
Analytics Manager Resume Guide 2026: Metrics, Experimentation, and ATS Skills That Win Interviews
Written by Argishti Yeghiazaryan
Listing SQL, Tableau, and Python without business impact leaves many Analytics Manager resumes stuck in ATS. Hiring teams want evidence that you shaped decisions, shipped trustworthy metrics, and improved outcomes at scale. This guide shows how to translate analytics work into measurable wins for 2026 applications.
Why many Analytics Manager resumes underperform
Common issues
- Tool dumps without outcomes or decisions influenced
- Vague metrics like engagement or reach with no tie to revenue or cost
- Bullets focused on reporting volume instead of decision velocity
- No ownership of definitions, governance, or data quality
- Missing experimentation rigor and guardrails
- Leadership claims unsupported by hiring, coaching, or operating cadence
- Formatting that breaks in ATS parsing or hides keywords in images or graphics
Fix the narrative
- Tie analyses to a decision, a metric change, and a business result
- Quantify time-to-insight, self-serve adoption, and stakeholder coverage
- Show program ownership: experimentation, KPI frameworks, data contracts, SLAs
How hiring teams evaluate Analytics Managers in 2026
Core rubric
- Scope and ownership: teams managed, domains covered, budgets, roadmap ownership
- Business outcomes: revenue, margin, conversion, CAC/LTV, retention, churn, cost-to-serve
- Decision enablement: time-to-insight reduction, self-serve BI adoption, data literacy gains
- Experimentation: A/B design quality, sample size, guardrails, experiment velocity
- Data governance: metric definitions, dbt or semantic layer standards, data quality SLAs
- Cross-functional influence: PM, Marketing, Product, Finance, Sales, Ops, Legal, Security
- Technical depth: SQL optimization, Python or R for advanced analytics, BI modeling, warehouse fluency
What changes the decision
- Specific lifts or savings linked to initiatives you led
- Clear operating cadence: weekly reviews, OKRs, intake triage, prioritization framework
- Evidence of scale: dashboards serving thousands, models covering multiple markets, analytics used across product lines
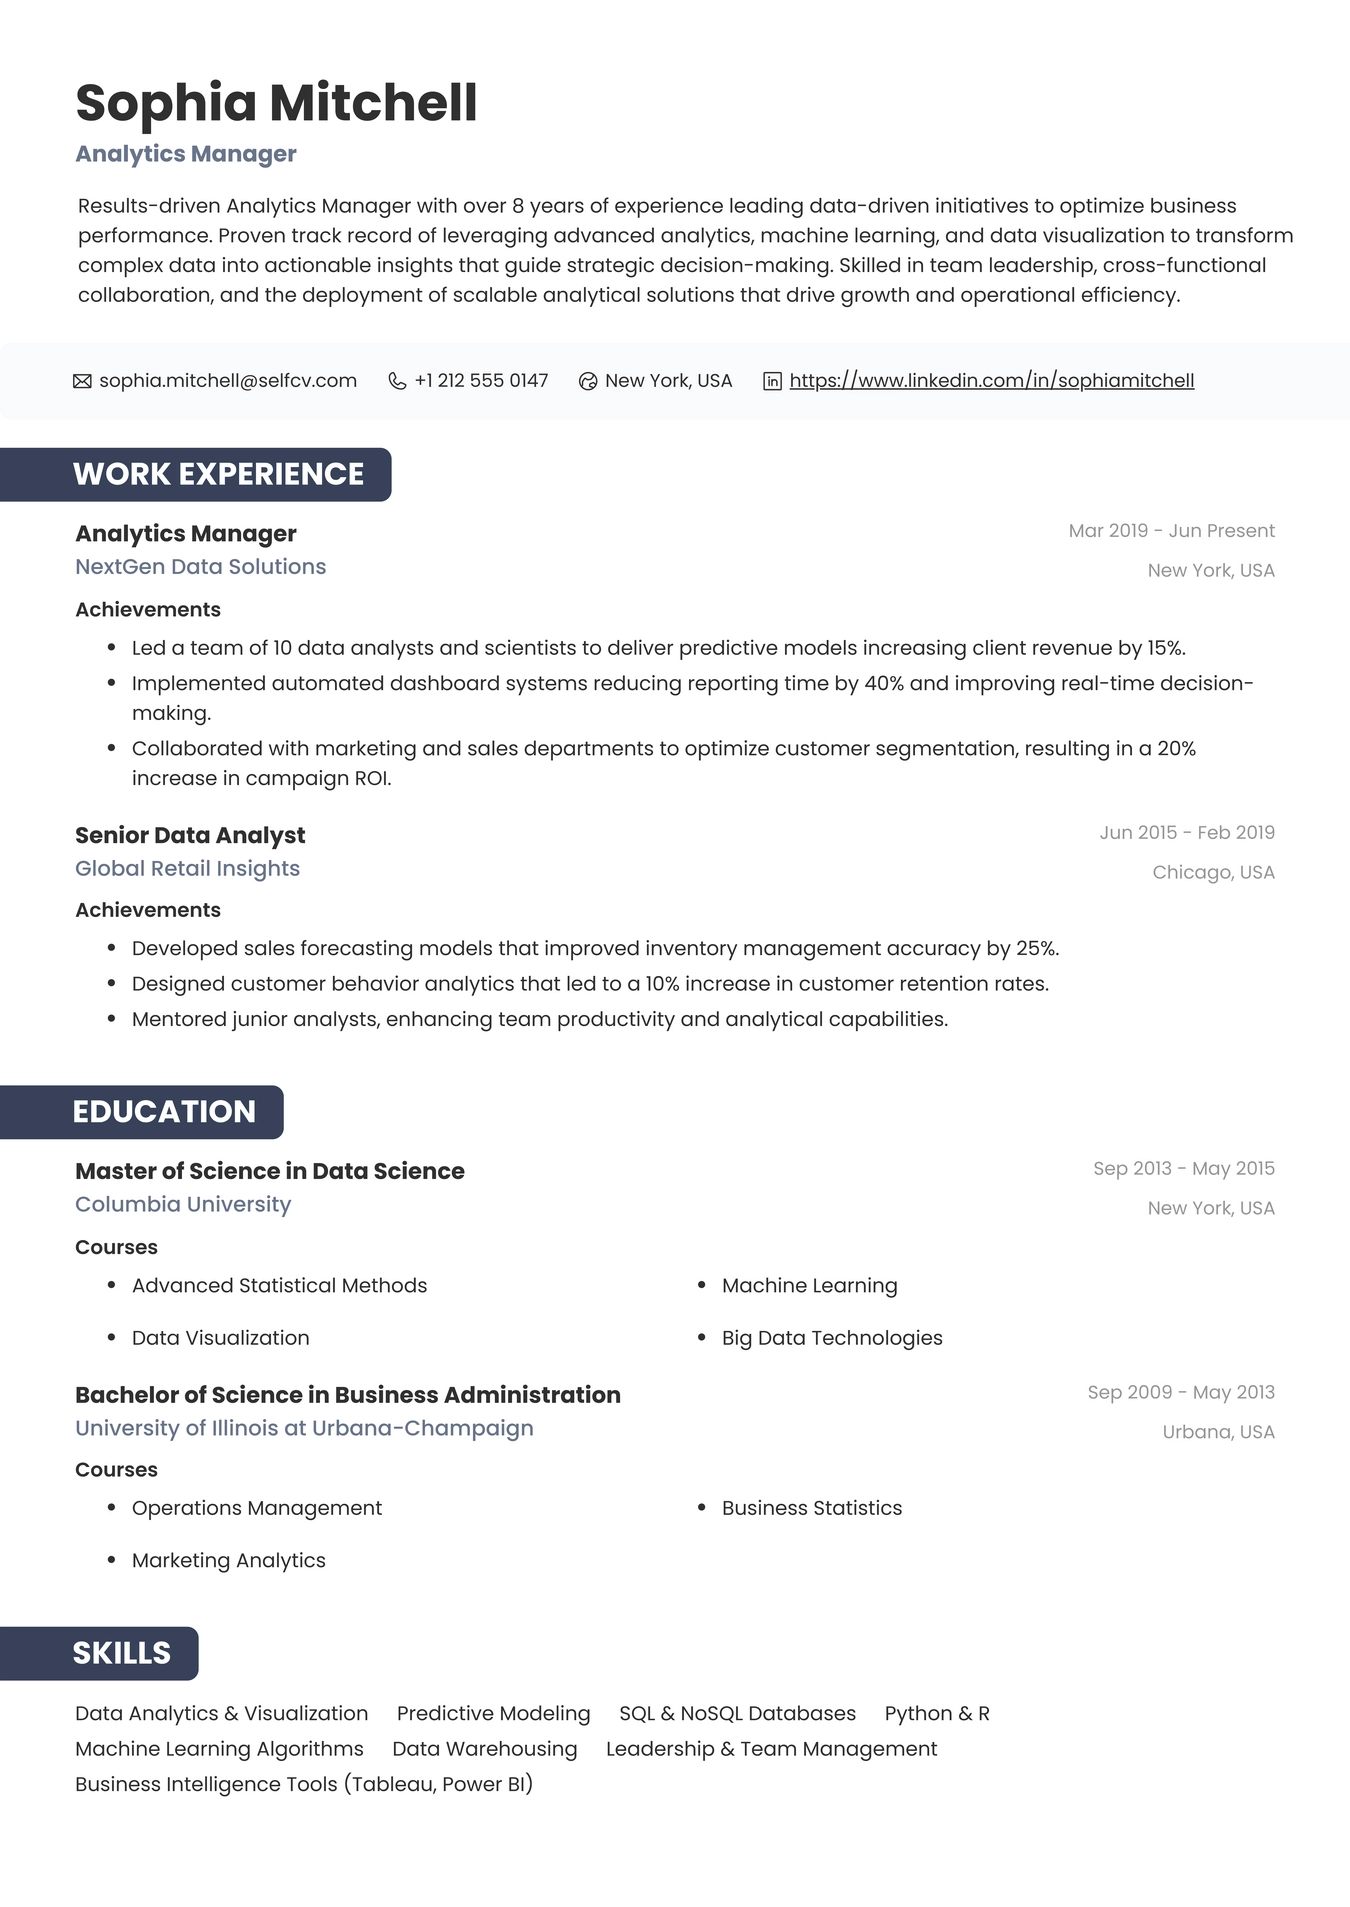
Resume Example for Analytics Manager
Fast ATS setup and formatting that parses
File and format
- File type: PDF or DOCX per posting, standard fonts, no text in images
- File name: FirstName_LastName_Analytics_Manager_2026
- Length: 1 page for junior or compact mid, 2 pages for senior or lead scope
- Structure: Summary, Skills Matrix, Experience, Projects, Education, Certifications
Keywords to include naturally
- Core: analytics strategy, KPI framework, experiment design, A/B testing, causal inference, cohort analysis, churn, LTV, CAC, attribution, forecasting, segmentation, SQL, Python, R, dbt, data modeling, semantic layer, LookML, Tableau, Power BI, Looker, GA4, Mixpanel, Amplitude, Snowflake, BigQuery, Redshift, Airflow, data governance, data quality, data contracts, privacy, GDPR, CCPA, HIPAA, anomaly detection, SLA, stakeholder management, roadmap, OKRs
- Product analytics focus: feature adoption, activation, retention cohorts, funnels, event taxonomy, user segmentation, experiment guardrails, Amplitude, Mixpanel, GA4
- Marketing analytics focus: MMM, MTA, attribution, ROAS, CAC payback, lead scoring, Salesforce, Marketo, Braze, Iterable, incrementality
- Business analytics focus: revenue forecasting, pricing elasticity, margin analysis, unit economics, SQL, Tableau, Power BI, Finance partnership
Placement tips
- Put priority keywords in Summary and top bullets
- Reflect the job description phrasing when accurate for your experience
- Avoid keyword stuffing lists without achievements that prove them
One-page vs two-page and structure by seniority
Junior or Associate Analytics Manager (player-coach)
- 1 page, concise impact bullets, 6-10 key skills, 1-2 projects
Mid-level Analytics Manager
- 1-2 pages, emphasis on domain ownership, 2-3 major initiatives, leadership of 1-3 analysts
Senior or Lead Analytics Manager
- 2 pages, program scope, roadmap ownership, 3-7 analysts managed, cross-functional steering
Recommended order
- Header with location and contact
- Headline and Summary
- Skills Matrix grouped by category
- Experience with metrics-first bullets
- Projects or Initiatives section for strategic work
- Education and relevant certifications
Headline and summary examples by specialization and industry
Format
- Headline: Analytics Manager plus specialization or domain
- Summary: 3-4 lines with scope, methods, tools, and business results
Product Analytics Manager, SaaS
- Headline: Analytics Manager - Product and Growth
- Summary: Analytics leader improving activation and retention for B2B SaaS. Built event taxonomy and Amplitude governance, cut time-to-insight by 40%, and scaled experiment velocity from 2 to 8 per month. Fluent in SQL, Python, dbt, BigQuery, Looker.
Marketing Analytics Manager, e-commerce
- Headline: Marketing Analytics Manager - Attribution and Lifecycle
- Summary: Drove 15% ROAS lift via MMM and incrementality tests. Implemented GA4, migrated to server-side tagging, and launched Braze analytics to personalize lifecycle journeys. Expert in SQL, Python, Power BI, BigQuery.
Business Analytics Manager, fintech
- Headline: Analytics Manager - Risk and Commercial
- Summary: Owned unit economics and credit risk dashboards across 5 markets. Built churn models that reduced losses by 8% while improving approval rates. Tools include Snowflake, dbt, Tableau, Python.
Healthcare Analytics Manager
- Headline: Analytics Manager - Clinical and Operational Insights
- Summary: Improved appointment utilization by 12% and reduced no-shows with propensity modeling. Established HIPAA-aligned metric definitions and automated quality checks. SQL, R, Power BI, Redshift.
Career-switch summary examples
- Junior/Associate: Senior Analyst stepping into player-coach role. 5 years in SQL, Python, and Tableau. Led 2 analysts informally, cut dashboard latency by 60%, and partnered with PMs on 10 A/B tests.
- Senior: Senior Analytics Manager leading a 5-person team across product and lifecycle. Scaled self-serve BI to 1,200 monthly users, reduced ad waste by 14%, and implemented dbt and metric layer governance.
- Consulting to in-house: Analytics consultant moving in-house to own experimentation and KPI frameworks. Delivered pricing elasticity models for 6 clients and enabled CFO reporting that saved 300 analyst hours per quarter.
Skills matrix that works in ATS
Group by category and list depth where relevant
Data and tooling
- SQL, Python, R, dbt, Git, Airflow
- Warehouses: Snowflake, BigQuery, Redshift
- BI: Looker, Tableau, Power BI, LookML, semantic layer
- Product analytics: GA4, Mixpanel, Amplitude, event taxonomy
Methods
- Experiment design, A/B and multivariate testing, CUPED, sequential testing, guardrails
- Causal inference, difference-in-differences, propensity matching
- Forecasting, time series, ARIMA, Prophet, seasonality, trend decomposition
- Segmentation, clustering, LTV, churn, uplift modeling, survival analysis
Data operations and quality
- Data modeling, dimensional modeling, star schema, data contracts, tests in dbt
- Anomaly detection, SLAs, monitoring, observability
Compliance and privacy
- GDPR, CCPA, HIPAA basics, consent management, PII handling, access control
Leadership and operations
- Roadmapping, intake prioritization, stakeholder management, OKRs, hiring, coaching, enablement
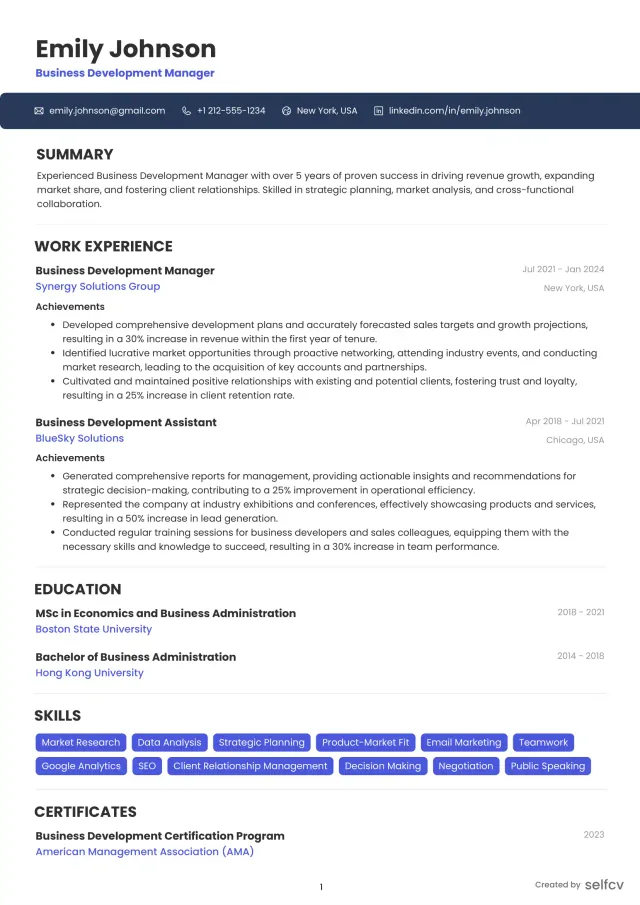
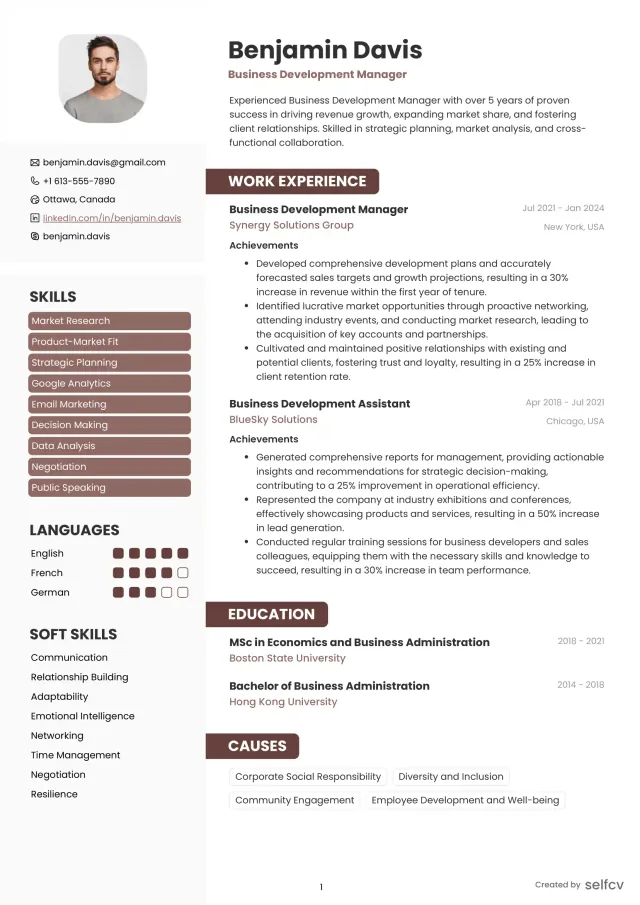
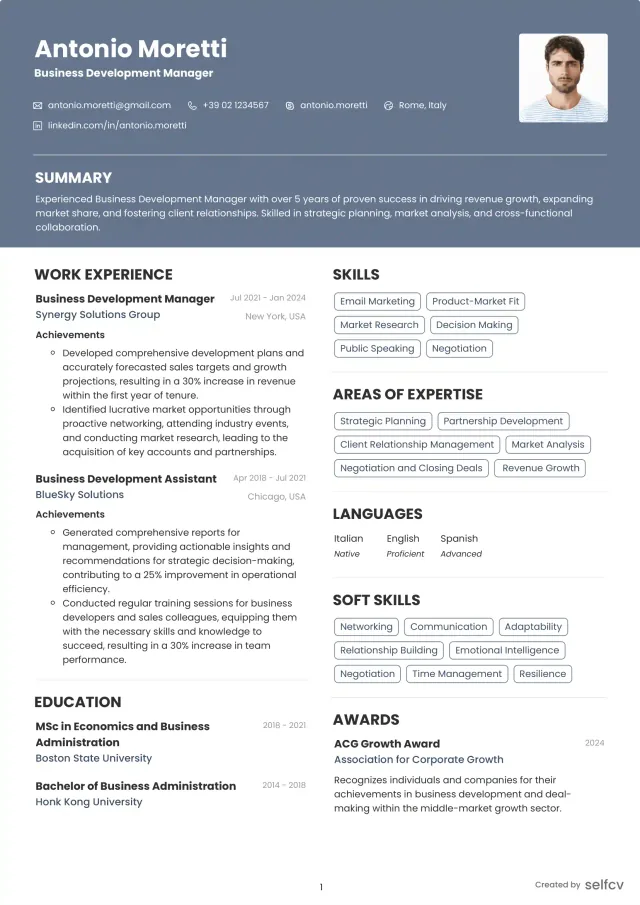
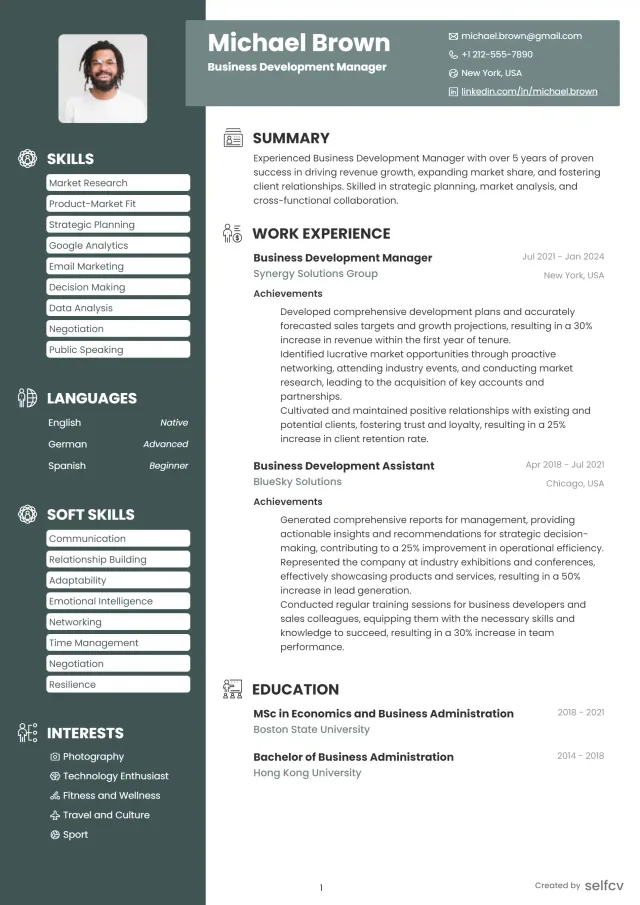
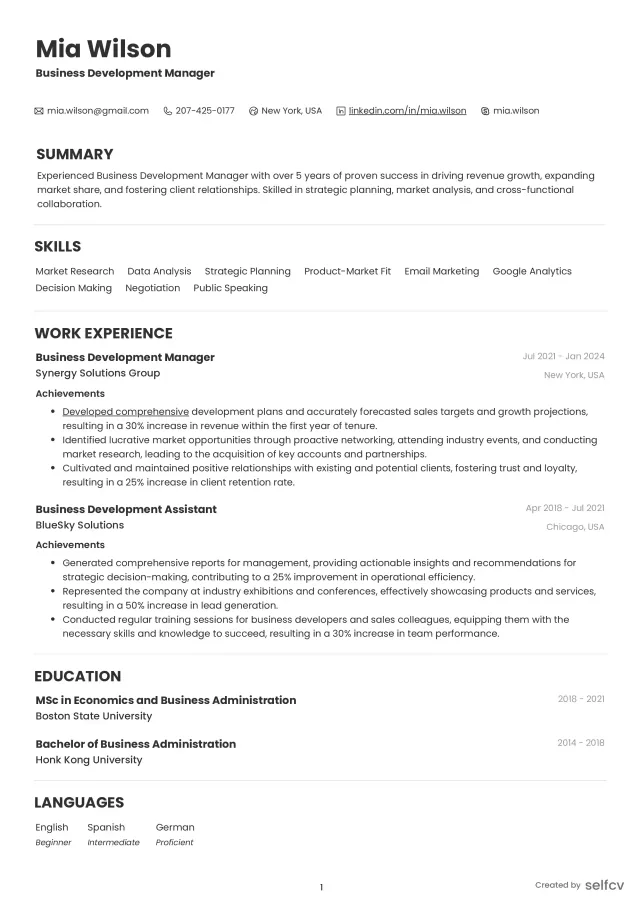
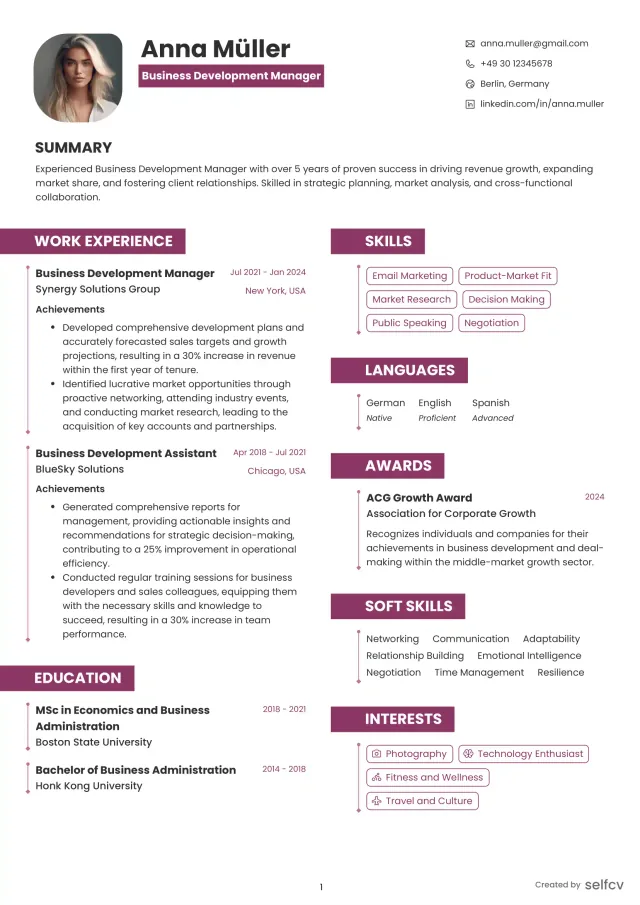
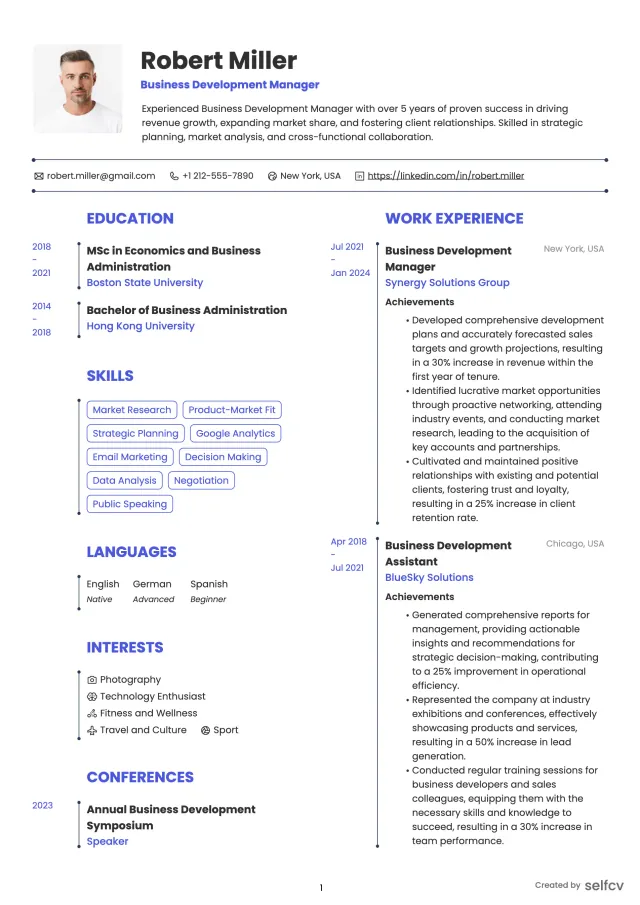
Find the template that’s right for you
No need to build anything from scratch. Using our templates or upload feature, you’ll get started easily and have a powerful resume in a few clicks.
Write bullets that show decisions and results
Use this formula
- Action + Method + Metric + Decision Impact
Before and after example
- Before: Built dashboards for sales leadership.
- After: Built revenue dashboard in Looker with standardized definitions, reducing weekly forecast variance by 28% and enabling pricing adjustments that added 2.1% margin.
Weak-to-strong examples
Example 1:
Weak: Analyzed user behavior to improve retention.
Strong: Ran retention cohort analysis and survival models that identified a 3-day activation gap, informing onboarding changes that increased 90-day retention by 6.4%.
Why it works: Names the method, pinpoints a decision, and quantifies the lift.
Example 2:
Weak: Managed analysts and collaborated with PMs.
Strong: Led a 4-analyst pod supporting 5 PMs, introduced a weekly experiment review, and grew test velocity from 3 to 11 per month with a 20% winner rate.
Why it works: Shows scope, cadence, and throughput.
Example 3:
Weak: Migrated tracking events.
Strong: Rebuilt event taxonomy for GA4 and Amplitude, cut duplicate events by 72%, and increased trustworthy event coverage from 58% to 94% across web and iOS.
Why it works: Ties governance to quality metrics that enable better analysis.
Experimentation and A-B testing bullets that withstand scrutiny
What to include
- Hypothesis, primary metric, guardrails, traffic split, sample size, test duration, approval process
- Decision made after the test and business result
Good bullet patterns
- Launched pricing A/B with CUPED variance reduction, reached 90% power in 14 days, and improved checkout conversion by 3.2% without raising refund rate.
- Built experiment governance with pre-registration, metric library, and sequential testing guardrails, reducing false positives by 35%.
- Partnered with Legal and Finance on test holdouts for email send volume, confirming 12% incremental revenue vs modeled MTA.
Check Your Resume with ATS
Make sure your resume passes Applicant Tracking Systems before recruiters see it.
- 📄 Upload your resume and get instant ATS feedback
- 🎯 Improve keyword matching for your target job
- ⚡ Boost your chances of getting shortlisted
Data governance, quality, and compliance on your resume
Show operational maturity
- Defined metric owners and data contracts with product and data engineering
- Introduced dbt tests, schema checks, and anomaly alerts with SLAs
- Reduced data incidents and improved trust scores or adoption
Examples
- Implemented dbt and LookML standards, lifting dashboard trust score from 3.1 to 4.6 out of 5 and cutting ad hoc requests by 38%.
- Rolled out PII access controls and audit logs aligned to GDPR and HIPAA needs, reducing sensitive-data exposure incidents to zero.
- Migrated to GA4 with server-side tagging, preserving attribution while meeting consent requirements.
Cross-functional influence, decision velocity, and self-serve BI
Make influence visible
- Name stakeholder groups and meeting cadences
- Quantify how quickly decisions were made and how widely analytics was used
Examples
- Centralized KPI tree with Finance and Product, cutting time-to-insight on weekly business review from 3 days to 6 hours.
- Scaled self-serve BI to 900 monthly active users with role-based training, lowering ad hoc ticket queue by 45%.
- Facilitated quarterly roadmap planning with PM, Marketing, and Sales, aligning analytics OKRs to product and revenue targets.
Projects and initiatives to feature in 2026
Strong project topics
- GA4 migration and event taxonomy redesign
- Attribution overhaul: MMM plus experiments for incrementality
- Self-serve BI rollout with semantic layer and governance
- KPI tree redesign aligned to unit economics
- Churn or propensity models and retention playbooks
- Experimentation program setup and guardrails
- dbt or LookML standards and data contract adoption
Project bullet example
- Led self-serve BI rollout on Looker with metric layer, trained 150 go-to-market users, achieved 75% dashboard adoption and reduced time-to-decision on promos from 5 days to 24 hours.
Career-level playbooks with measurable indicators
Junior or Associate Analytics Manager
- Indicators: 0-2 direct reports, player-coach, 1-2 domains, 1-page resume
- Sample wins: reduced dashboard refresh time by 60%, implemented 10 experiment analyses with valid SSO metrics, created first KPI tree for a product area
Mid-level Analytics Manager
- Indicators: 2-4 direct reports, domain ownership, partner to 3-6 PMs or a marketing leader
- Sample wins: increased experiment velocity from 2 to 8 per month, standardized event taxonomy, improved conversion by 2-5%
Senior Analytics Manager
- Indicators: 4-7 direct reports, multi-domain scope, budget, roadmap ownership
- Sample wins: launched self-serve BI for 500+ users, reduced CAC by 10-15% via attribution and bidding changes, implemented data SLAs and anomaly detection
Lead or Principal Analytics Manager
- Indicators: manager-of-managers or cross-org program ownership
- Sample wins: enterprise metric layer rollout, 1,000+ self-serve users, 20% reduction in data incidents, global experimentation center of excellence
Industry modules and domain KPIs
SaaS and product-led growth
- KPIs: activation, DAU/WAU, retention cohorts, expansion, LTV, payback
- Example: Improved activation-to-week-4 retention from 32% to 38% by iterating onboarding with 6 controlled experiments
E-commerce and retail
- KPIs: conversion rate, AOV, ROAS, CAC, margin, return rate, inventory turns
- Example: MMM plus geo tests changed channel mix, adding 12% incremental revenue at stable margin
Fintech and risk
- KPIs: approval rate, loss rate, CAC, LTV, fraud rate, chargebacks, reserves
- Example: Risk segmentation model improved approval by 3 pts at constant expected loss, lifting LTV by 7%
Healthcare and life sciences
- KPIs: appointment utilization, readmissions, care gaps closed, claims accuracy
- Example: No-show propensity model guided reminders, reducing no-shows by 18% within HIPAA constraints
Manufacturing and IoT
- KPIs: OEE, downtime, scrap rate, maintenance cost, on-time delivery
- Example: Forecast model cut unplanned downtime by 9% across 4 plants
Portfolio and artifacts without exposing confidential data
What to showcase
- Dashboard screenshots with fake or obfuscated data
- Experiment design templates, sample pre-registration forms, metric catalogs with redacted numbers
- Data model diagrams and dbt test examples without schema secrets
- Analytics roadmap, OKRs, enablement materials
How to reference
- Use neutral names like Product A or Market X
- Replace exact values with indexed or percentage figures
- Note tools and methods, not proprietary logic
Red flags hiring teams notice and how to fix them
Red flag: Vanity metrics without decisions
- Fix: Tie analysis to a decision and a business result
Red flag: Causality claims from observational data without controls
- Fix: Mention design, controls, or caveats and frame as correlation if causal proof is not established
Red flag: Listing 20 tools with no depth
- Fix: Prioritize 6-10 core tools and show outcomes tied to them
Red flag: Confidential data leaks
- Fix: Use percentages or ranges, anonymize products and markets, avoid PII or client names without permission
Red flag: Leadership without evidence
- Fix: Add headcount, hiring outcomes, training programs, cadence, and adoption metrics
Complete Analytics Manager resume example
The candidate, companies, and career history shown are fictional examples created for illustration and any resemblance to a real person or organization is coincidental.
Candidate Name
Leah Matsuda
Target Position
Senior Analytics Manager - Product and Growth
Location
Toronto, Canada
Professional Summary
Senior Analytics Manager with 8 years in product and lifecycle analytics for B2B SaaS. Led a 5-analyst team, scaled experiment velocity from 3 to 12 per month, and increased activation-to-Week4 retention by 7 pts. Built GA4 and Amplitude governance, a metric layer in Looker, and dbt standards on BigQuery. Known for reducing time-to-insight by 45% and aligning analytics to revenue OKRs.
Grouped Skills
- Data: SQL, Python, dbt, Git, Airflow, BigQuery, Snowflake
- BI: Looker, LookML, Tableau, semantic layer
- Product analytics: GA4, Amplitude, Mixpanel, event taxonomy
- Methods: A/B testing, CUPED, causal inference basics, cohort analysis, LTV, churn, time series
- Operations: KPI frameworks, data contracts, anomaly detection, SLAs, roadmap, OKRs
- Compliance: GDPR, CCPA, consent management
Professional Experience
Northbeam Cloud, Toronto, Canada
Senior Analytics Manager, Product and Growth, 2023-2026
- Built experiment governance with pre-registration and guardrails, growing test velocity from 3 to 12 per month and improving win rate to 22%.
- Redesigned activation funnel metrics and event taxonomy in GA4 and Amplitude, cutting duplicate events by 68% and raising trustworthy coverage to 96%.
- Introduced Looker metric layer and dbt testing, lifting dashboard trust score from 3.2 to 4.7 and reducing ad hoc tickets by 41%.
- Partnered with PM and Design to address a 3-day activation gap, increasing 90-day retention by 6.9% and expanding plan upgrades by 4.1%.
- Rolled out enablement for 400 GTM users, taking time-to-decision on promo changes from 4 days to under 24 hours.
Aperture Analytics, Vancouver, Canada
Analytics Manager, 2020-2023
- Owned lifecycle analytics for trials-to-paid motion, running 20 experiments in 12 months and improving trial conversion by 2.6 pts.
- Built MMM plus geo holdouts for paid search and paid social, reallocating budget to add 10% incremental revenue at stable CAC.
- Hired and mentored 3 analysts, established a weekly insights cadence with Marketing and Finance, and cut reporting cycle time by 50%.
OrbitSoft, Remote
Senior Data Analyst, 2018-2020
- Delivered pricing elasticity analysis that informed 2 price tests, improving ARPU by 3% without increasing churn.
- Automated cohort dashboards in Looker using LookML and dbt, reducing manual work by 15 hours per week.
Education / Training
- BSc, Statistics, University of British Columbia
- Coursework: Experimental Design, Time Series, Econometrics
Certifications
- dbt Fundamentals
- GA4 Certification
- Looker LookML Developer
FAQs: Analytics Manager resume questions for 2026
What should an Analytics Manager resume include to pass ATS in 2026?
- Include role-aligned keywords such as KPI framework, experiment design, SQL, Python, dbt, Snowflake or BigQuery, Looker or Tableau, data contracts, GDPR. Place them in Summary, Skills, and top bullets. Keep clean formatting.
How do I prove impact beyond dashboards and reports?
- Tie analysis to a decision and then the outcome. Example: Standardized margin definition in Looker, reducing forecast variance by 25% and enabling pricing changes that added 1.8% margin.
How do I write bullets for A/B tests with valid metrics?
- State hypothesis, primary metric, power or sample size, guardrails, and duration. Add the decision and measurable lift, not just a winner label.
Is a one-page or two-page resume better for an Analytics Manager?
- 1 page for junior or compact mid. 2 pages for senior, lead, or multi-domain ownership. Prioritize clarity and outcomes over breadth.
Which skills and tools matter most?
- SQL at an advanced level, plus Python or R for analysis. BI modeling in Looker, Power BI, or Tableau. dbt or similar for modeling and tests. Cloud warehouses such as Snowflake, BigQuery, or Redshift. Experimentation methods and governance.
How can I show team leadership and mentorship?
- Include team size, hiring, onboarding, operating cadence, enablement programs, and adoption metrics. Example: Trained 150 users and cut ad hoc tickets by 40%.
What if my metrics are confidential or I signed NDAs?
- Use percentages, deltas, or indexed values. Anonymize product names and markets. Focus on direction and scale without exposing sensitive numbers.
Related careers to consider
- Product Analytics Manager
- Marketing Analytics Manager
- Business Intelligence Manager
- Data Science Manager
- Growth Analytics Lead
- Experimentation Program Manager
- Insights and Research Manager
- Data Platform Analytics Lead
Final checklist and 7-day optimization plan
Resume checklist
- Headline clarifies specialization and industry
- Summary lists scope, core tools, and 2-3 business outcomes
- Skills matrix grouped by data, methods, BI, governance, compliance, leadership
- Experience bullets use Action + Method + Metric + Decision Impact
- Experimentation bullets include hypothesis, sample size or power, guardrails, and results
- Governance shows definitions, data contracts, tests, and SLAs
- Cross-functional influence and enablement are quantified
- Projects highlight GA4 migration, attribution, metric layer, or self-serve BI
- Education and optional certifications listed without inflating importance
- File name and formatting align to ATS
7-day plan
- Day 1: Extract 10 achievements tied to a decision and result, then pick the top 6
- Day 2: Rewrite bullets with the formula and add missing metrics
- Day 3: Build a clean Skills Matrix and remove tool bloat
- Day 4: Add experimentation details and guardrails to 2-3 bullets
- Day 5: Document governance wins, SLAs, and trust metrics
- Day 6: Tailor keywords to 3 job descriptions and adjust Summary accordingly
- Day 7: Create a redacted portfolio snippet pack with dashboard captures, experiment templates, and metric catalogs
Close with care
Keep results specific, methods accurate, and data private. Align analytics work to decisions, velocity, and outcomes. That combination is what gets Analytics Managers interviews in 2026.
Why job seekers choose selfcv
Thousands of professionals use selfcv to build modern, ATS-friendly resumes, customize templates, and apply for jobs with confidence.
Thanks to SelfCV, I now have a professional and polished resume that I'm confident in sending to potential employers. I will definitely be recommending your service to other job seekers. Keep up the great work!
SelfCV offers an intuitive interface that makes creating a professional CV straightforward. Whether you're a student, a fresh graduate, or an experienced professional, the step-by-step process ensures that users of all levels can craft an impressive CV.
Easy to use resume builder. They have very intuitive ui for customizing and keeping multiple versions of resume.
The right tool for creating CVs. As a student I was looking for a tool that could help me quickly create a CV for internship applications. This was just the right tool. I am very satisfied!
This is one of the best tools I’ve ever used - I was able to build my CV in seconds with high quality template. Highly recommended!
Amazing app with easy user experience. Loved it. Its intuitive and easy to navigate, designs are very nice.
