
Business Intelligence Analyst Resume Examples for 2026
A Business Intelligence Analyst resume should show more than tool familiarity. It needs to prove that you can turn raw business data into reporting that people trust and use.
For 2026, employers hiring a Business Intelligence Analyst, BI Analyst, Reporting Analyst, Power BI Analyst, Tableau Analyst, SQL Analyst, Business Intelligence Developer, or Analytics Specialist want evidence of reporting clarity, metric consistency, stakeholder usefulness, and data discipline.
The strongest resumes show how you moved from data extraction to dashboard adoption, not just that you know SQL or visualization tools.
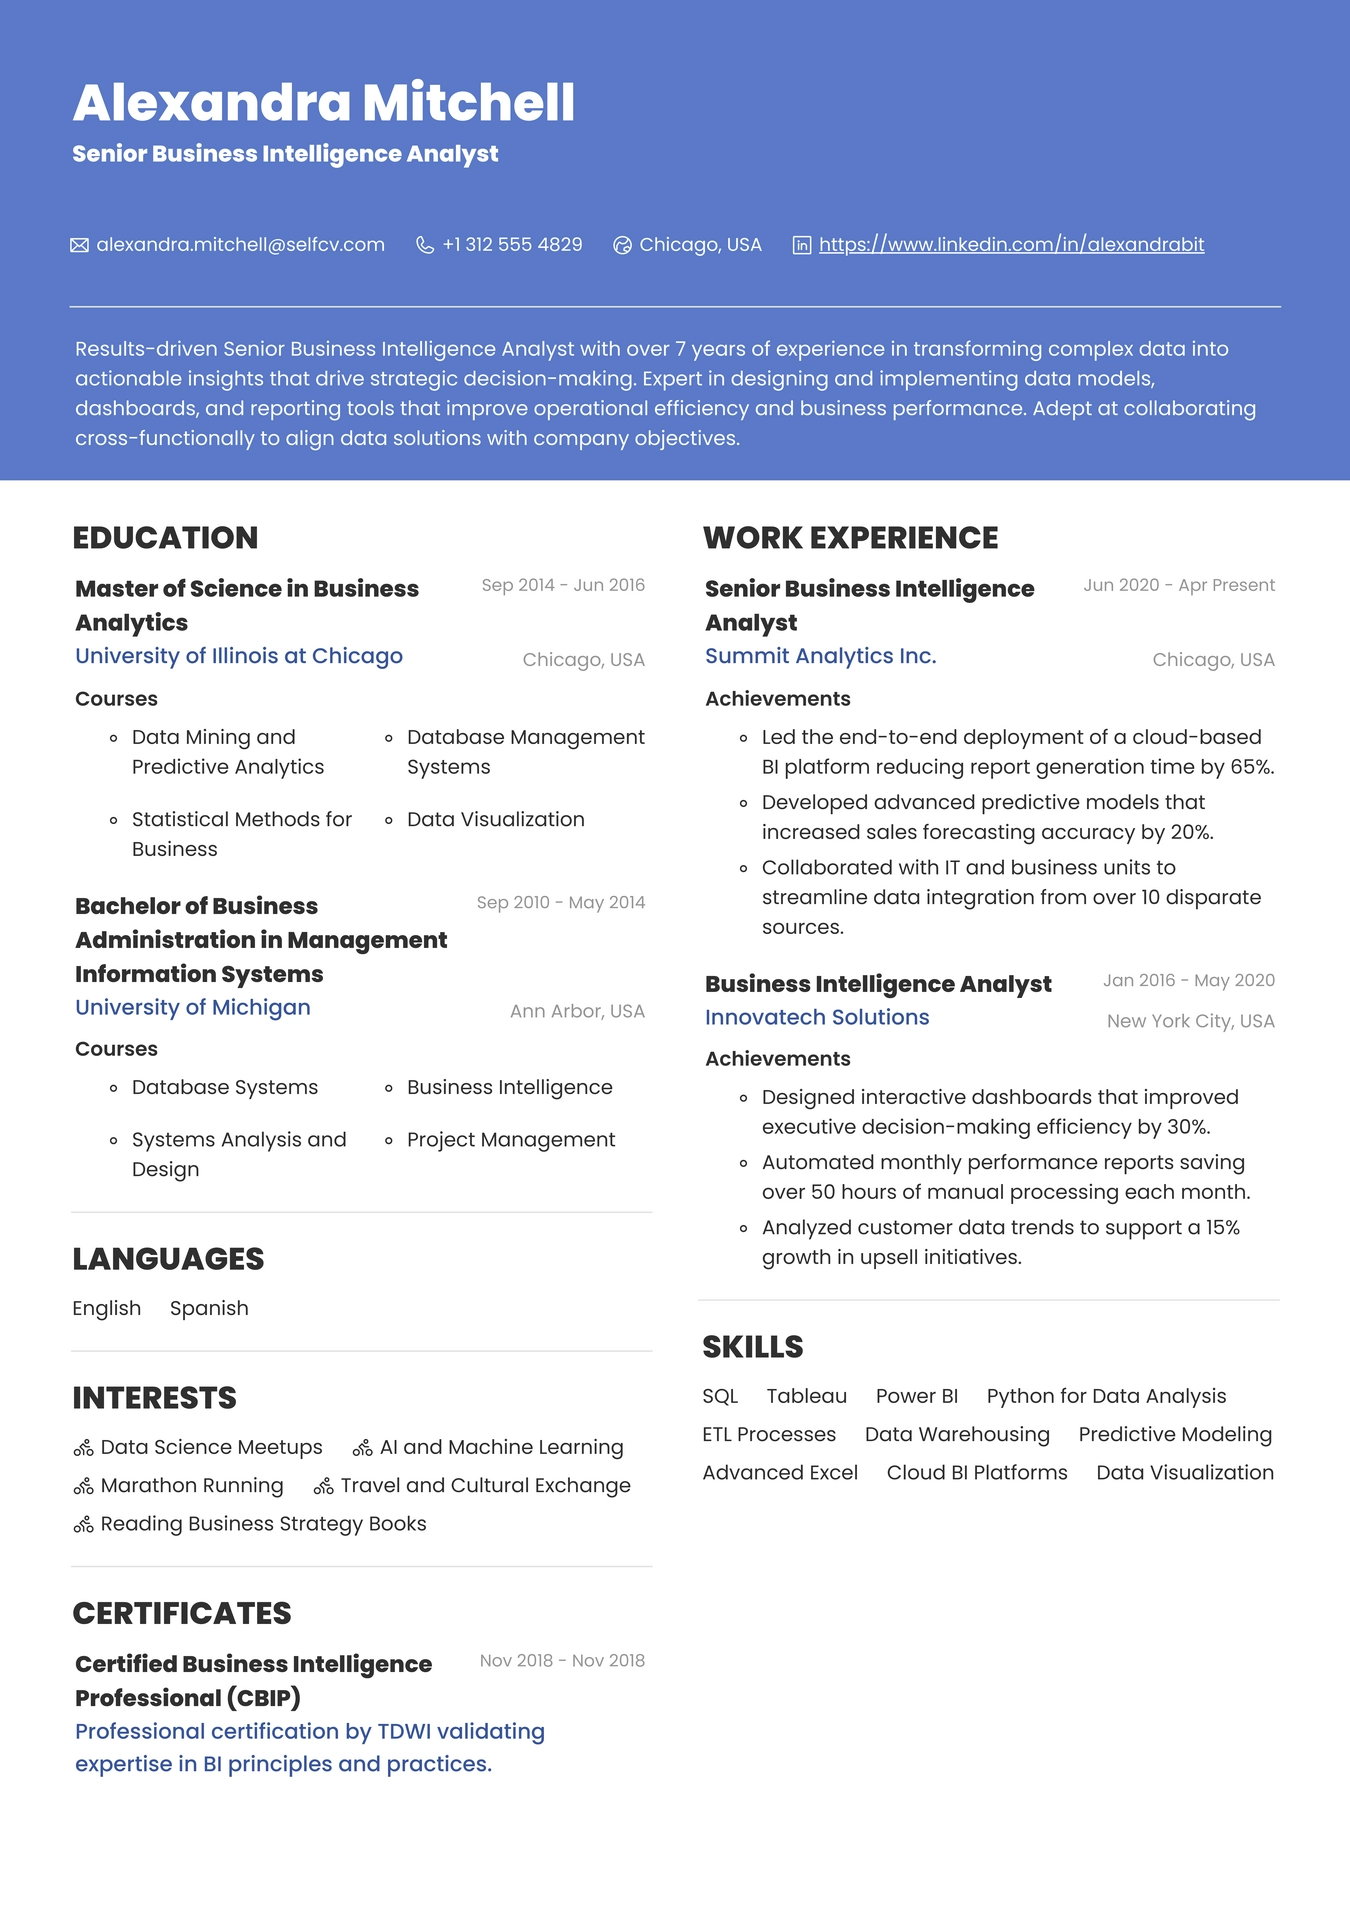
Business Intelligence Analyst resume example focused on reporting adoption
Priya Nandan
Business Intelligence Analyst
Birmingham, UK | Open to hybrid and remote roles across global English-speaking teams
Professional Summary:
Business Intelligence Analyst with 4 years of experience building dashboards, recurring reports, and KPI frameworks for commercial, operations, and finance teams. Skilled in SQL, Power BI, Tableau, Excel, Power Query, and stakeholder-facing reporting design. Known for improving reporting accuracy, replacing manual spreadsheet workflows, and translating business questions into reliable dashboards and clearly defined metrics.
Core Strengths:
Business intelligence reporting, SQL analysis, dashboard development, Power BI, Tableau, KPI design, data validation, report automation, stakeholder requirements gathering, Excel modeling, data visualization, metric documentation
Professional Experience:
Business Intelligence Analyst
Northline Commerce Group
April 2024 to Present
- Built Power BI dashboards for sales, gross margin, stock availability, and promotional performance across regional retail operations, giving managers a consistent weekly view of branch performance.
- Replaced five manually maintained Excel packs with automated SQL and Power Query reporting workflows, reducing weekly reporting preparation time from 9 hours to under 2 hours.
- Standardized core KPI definitions for revenue, markdown rate, sell-through, and stock coverage after finding inconsistent formulas across department reports.
- Worked with operations and merchandising teams to redesign dashboard layouts around the decisions managers needed to make, improving usage during weekly trade meetings.
- Added data checks for missing branch uploads, duplicate sales rows, and unusual category-level swings before scheduled refreshes reached leadership dashboards.
BI Reporting Analyst
Clearbridge Services
July 2022 to March 2024
- Created Tableau dashboards for customer support volume, resolution time, SLA performance, and team productivity for service operations leaders.
- Wrote SQL queries to join ticketing, workforce, and account data from multiple systems for monthly performance reporting.
- Partnered with department managers to turn ad hoc spreadsheet requests into reusable reports with filters, drilldowns, and role-based views.
- Documented source tables, business rules, and refresh timing for recurring reports, making handover and troubleshooting easier within the analytics team.
- Helped identify data mismatches between CRM and service systems that were affecting management reporting totals.
Data Analyst Intern
Westbrook Health Systems
January 2022 to June 2022
- Cleaned operational datasets in Excel and SQL for appointment, referral, and service utilization reporting.
- Prepared weekly summary reports for administrative teams by checking file completeness, naming consistency, and outlier values before submission.
- Supported dashboard updates and testing for internal reporting used by clinic managers.
Education:
BSc Business Analytics
University of Warwick
Completed 2021
Certifications and Training:
Microsoft Power BI Data Analyst training
Advanced SQL coursework
Tableau dashboard design workshop
Excel for reporting automation course
Technical Skills:
Data querying and preparation: SQL, Power Query, Excel, joins, data cleaning, validation checks
Visualization and reporting: Power BI, Tableau, dashboard design, KPI scorecards, self-service reporting, drilldowns
Reporting workflow: recurring reports, refresh monitoring, requirements gathering, business rule documentation, stakeholder feedback loops
Data environment exposure: CRM exports, ERP data, support systems, retail sales data, finance summaries, flat-file inputs
Selected Project Highlights:
Retail trade dashboard redesign
- Reorganized a weekly branch trading dashboard so regional managers could move from static tables to filterable KPI views by store, category, and trading period.
Service operations SLA reporting pack
- Helped convert monthly spreadsheet summaries into Tableau views that gave team leads faster visibility into backlog, response time, and breach risk.
Professional Strengths:
- Translates unclear reporting requests into usable dashboard logic and metric definitions.
- Balances visual clarity with data accuracy and stakeholder trust.
- Works comfortably with non-technical managers who need reliable answers quickly.
Why this Business Intelligence Analyst resume works
This example works because it treats business intelligence as decision support, not just dashboard production.
The candidate shows the full reporting chain: stakeholder need, source data, SQL logic, dashboard design, validation checks, and business outcome. That makes the resume more credible than a simple list of tools.
The metrics are realistic for a junior-to-middle Business Intelligence Analyst. Reducing weekly report preparation time, standardizing KPI definitions, improving dashboard usage, and catching broken uploads are believable signs of value.
It also shows range. The candidate supports operations, merchandising, service leaders, clinic managers, and finance-adjacent reporting, which helps the resume fit BI Analyst, Reporting Analyst, Data Visualization Analyst, and BI Reporting Specialist roles.
Resume Example for Business Intelligence
What employers want to see first on a BI resume
Hiring teams usually scan BI resumes for five things before they read in detail.
Reporting stack:
They want to see tools such as SQL, Power BI, Tableau, Excel, Power Query, Python, Looker Studio, or warehouse exposure. But those tools need to be tied to actual outputs.
Reporting deliverables:
Executive dashboards, scorecards, KPI packs, operational dashboards, self-service reports, variance reports, branch reporting, customer dashboards, or service reporting all help the role feel tangible.
Business users:
A strong BI resume should show who used the reporting. Common audiences include sales, finance, operations, product, marketing, customer support, or leadership teams.
Data discipline:
Metric definitions, source validation, refresh checks, business rules, documentation, and data-quality handling all show that the analyst understands trusted reporting.
Business value:
Hiring managers want to know whether your reporting saved time, replaced manual work, improved consistency, surfaced issues faster, or helped teams make decisions more clearly.
How to structure a Business Intelligence Analyst resume
A reverse-chronological format is usually best because BI hiring teams want to see your latest tools, reporting ownership, and business exposure first.
Recommended order for a junior BI Analyst:
Contact information and target title
Professional summary or objective
Technical tools and reporting skills
Projects, internships, or early-career experience
Education
Certifications and coursework
Optional portfolio or dashboard links
Recommended order for a middle-level BI Analyst:
Contact information and target title
Professional summary
Core BI tools and capabilities
Professional experience
Selected dashboards or reporting projects
Education
Certifications and training
Optional portfolio, domain expertise, or languages
Formatting tips:
- Keep tools focused on software you can discuss confidently.
- Make the most recent role show real reporting outputs, not only generic analysis language.
- If you include a portfolio, make it readable and business-focused.
- Separate resume subsections clearly so the document does not become one dense block.
Experience bullets that show reporting impact
The strongest Business Intelligence Analyst bullets usually connect a business question, the data work, the reporting output, and the result.
Examples:
- Built a Power BI dashboard for regional sales and stock coverage, helping operations leaders spot underperforming branches before weekly planning calls.
- Replaced manual spreadsheet consolidation with SQL-based reporting logic, reducing preparation time and lowering the risk of formula errors.
- Defined reporting rules for revenue, churn, backlog, or margin metrics after finding conflicting calculations across departments.
- Added refresh checks and exception flags that caught missing or duplicated source records before dashboards were distributed.
- Worked with finance and operations stakeholders to redesign a monthly performance pack around fewer, more decision-relevant KPIs.
- Created drill-through views that allowed managers to move from summary metrics into branch, product, or customer-level detail without requesting separate reports.
- Documented source tables, joins, filters, refresh timing, and known limitations so reports could be maintained by the wider team.
- Built Tableau visuals for service operations that highlighted SLA risk, backlog growth, and team-level workload trends.
- Used SQL to merge data from CRM, ticketing, and ERP systems for more complete business performance reporting.
- Standardized naming conventions and report logic across multiple dashboards, reducing confusion during executive reviews.
Before-and-after bullet upgrades for Business Intelligence Analyst resumes
Example 1:
Weak:
- Created dashboards for the business.
Strong:
- Built Power BI dashboards for sales, margin, and stock coverage, giving regional managers a filterable weekly view of performance by branch and category.
Why it works:
The stronger version explains the platform, the subject area, the users, and the reporting value.
Example 2:
Weak:
- Used SQL to analyze data.
Strong:
- Wrote SQL queries to combine CRM, order, and support data for monthly customer performance reporting used by sales and service leaders.
Why it works:
This version shows the datasets, the reporting purpose, and the audience.
Example 3:
Weak:
- Improved reporting processes.
Strong:
- Replaced five manual Excel reports with a Power Query and SQL workflow that cut weekly reporting preparation time from 9 hours to under 2 hours.
Why it works:
This shows the process change and the measurable benefit.
Example 4:
Weak:
- Worked with stakeholders on reports.
Strong:
- Gathered requirements from finance and operations managers, then redesigned a monthly KPI pack around fewer metrics, clearer variance views, and simpler drilldowns.
Why it works:
The stronger bullet shows collaboration, design thinking, and a better reporting outcome.
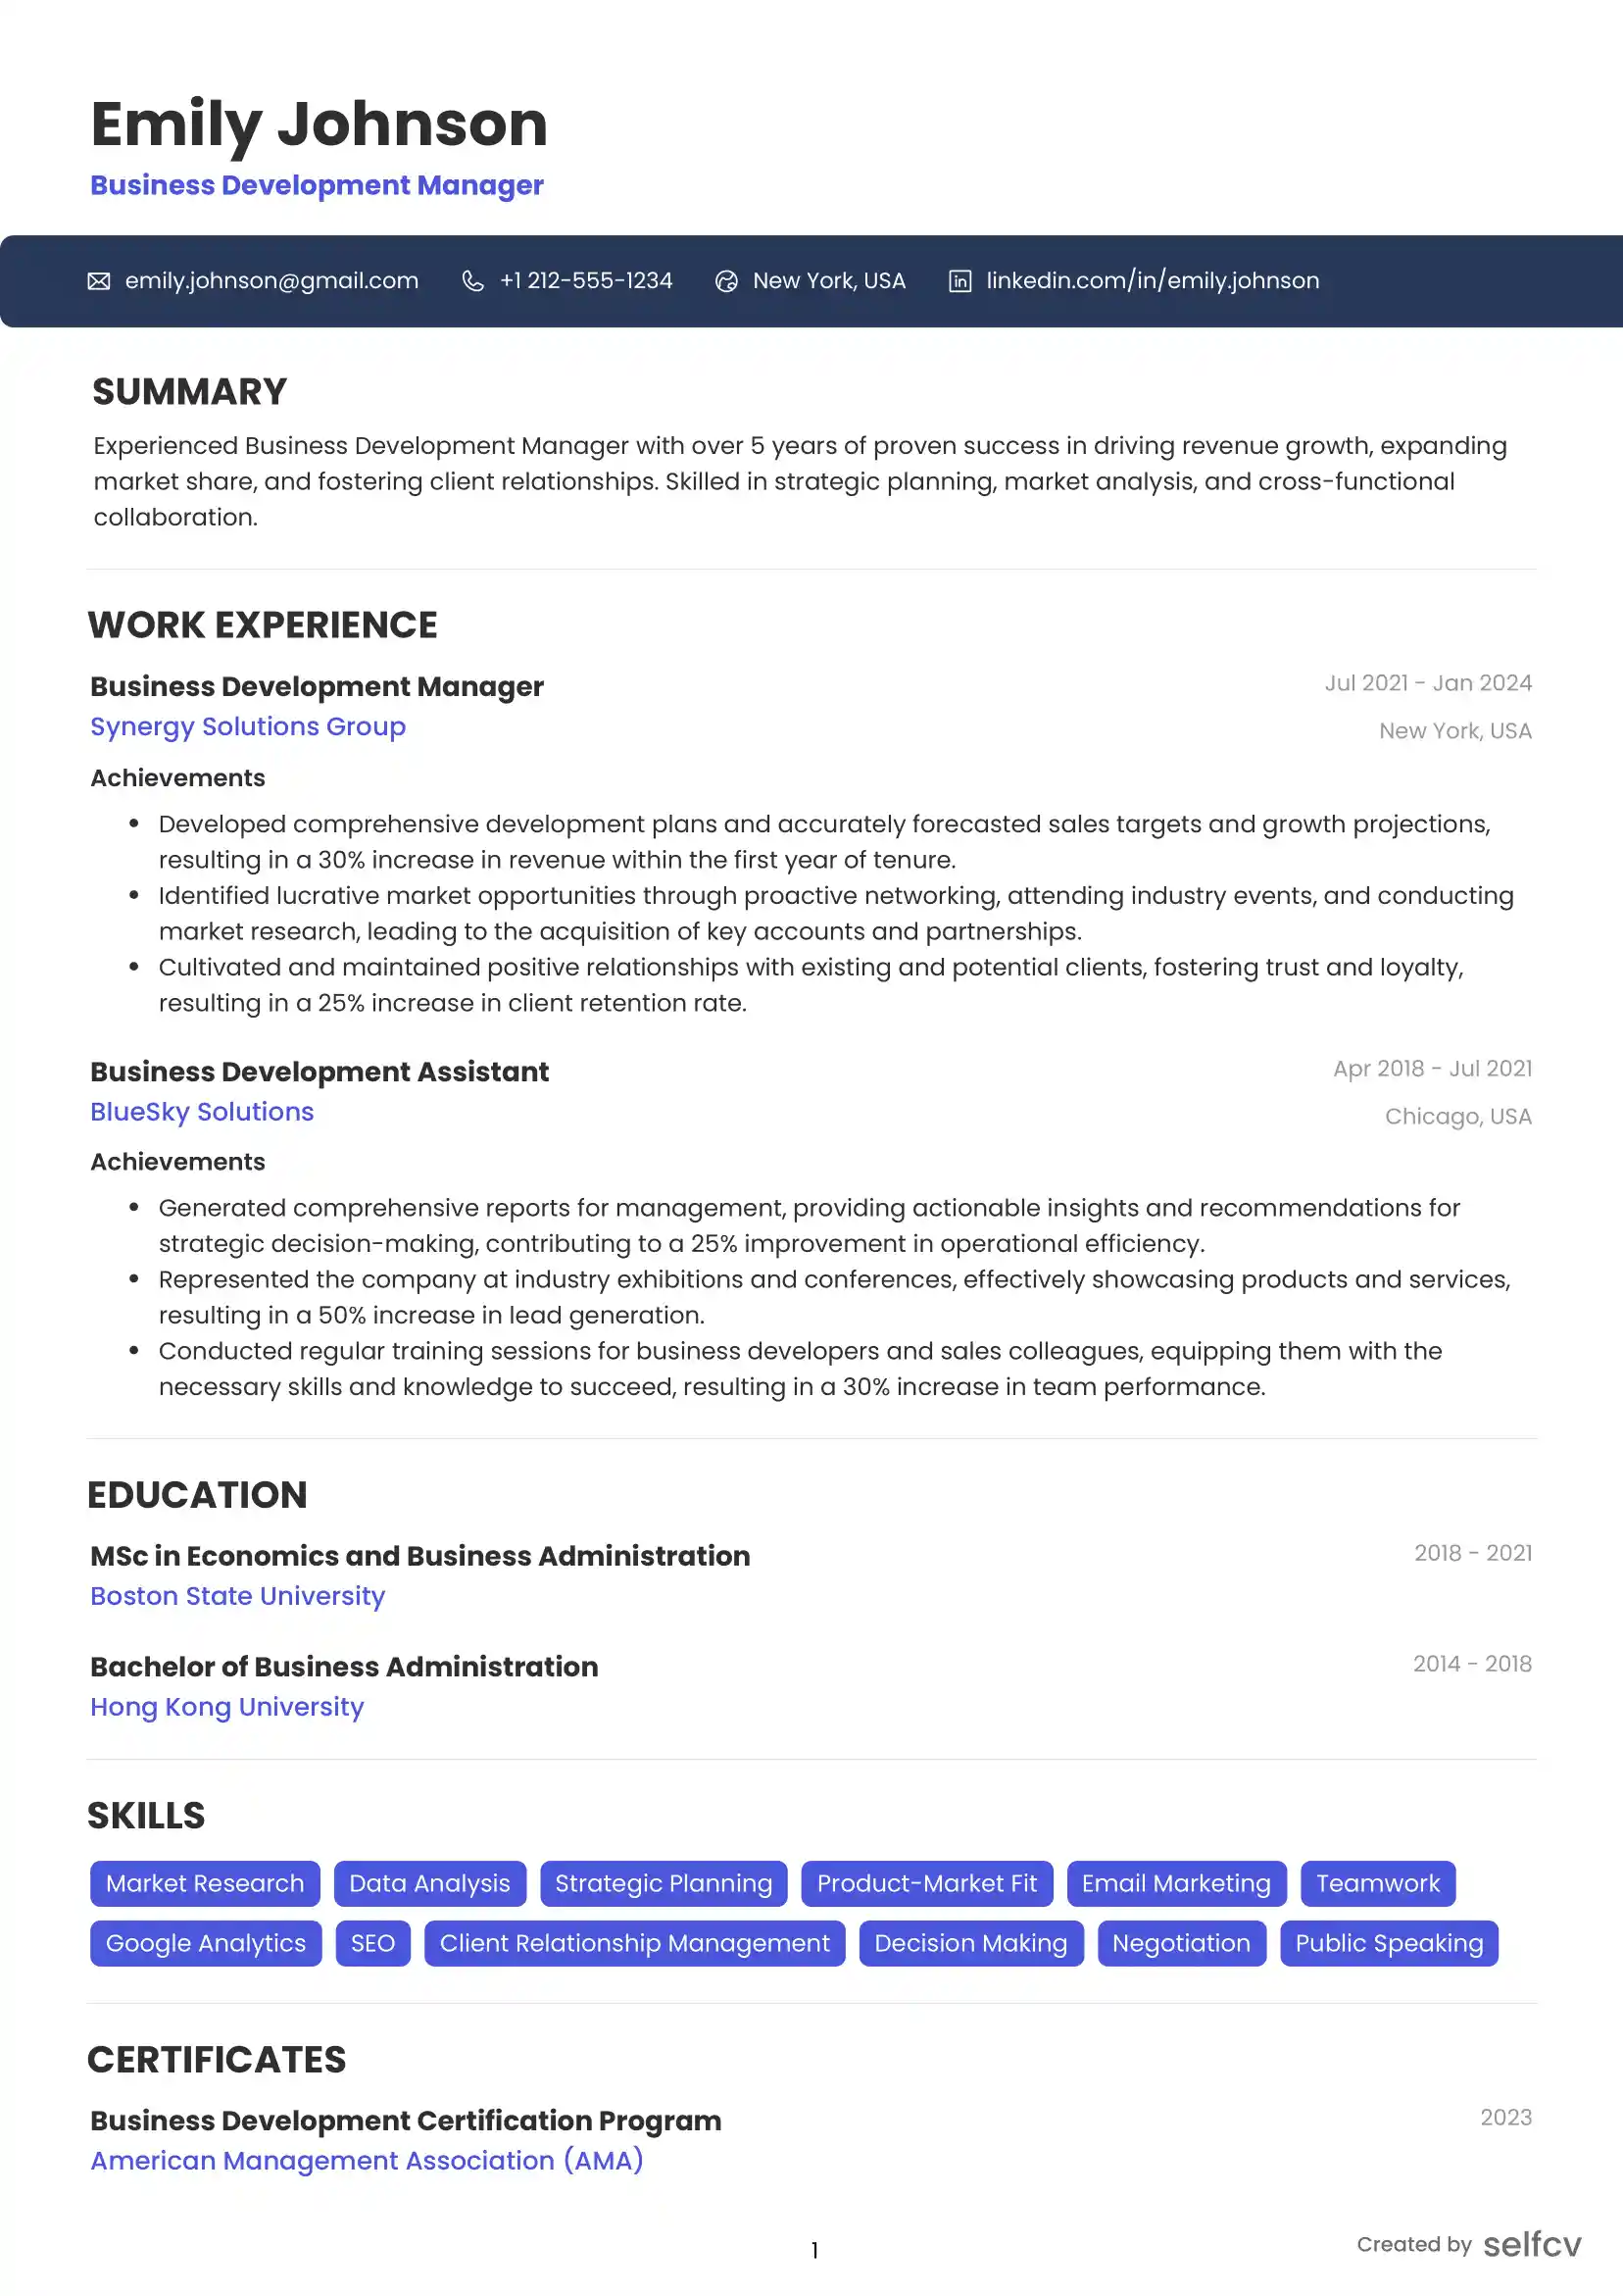
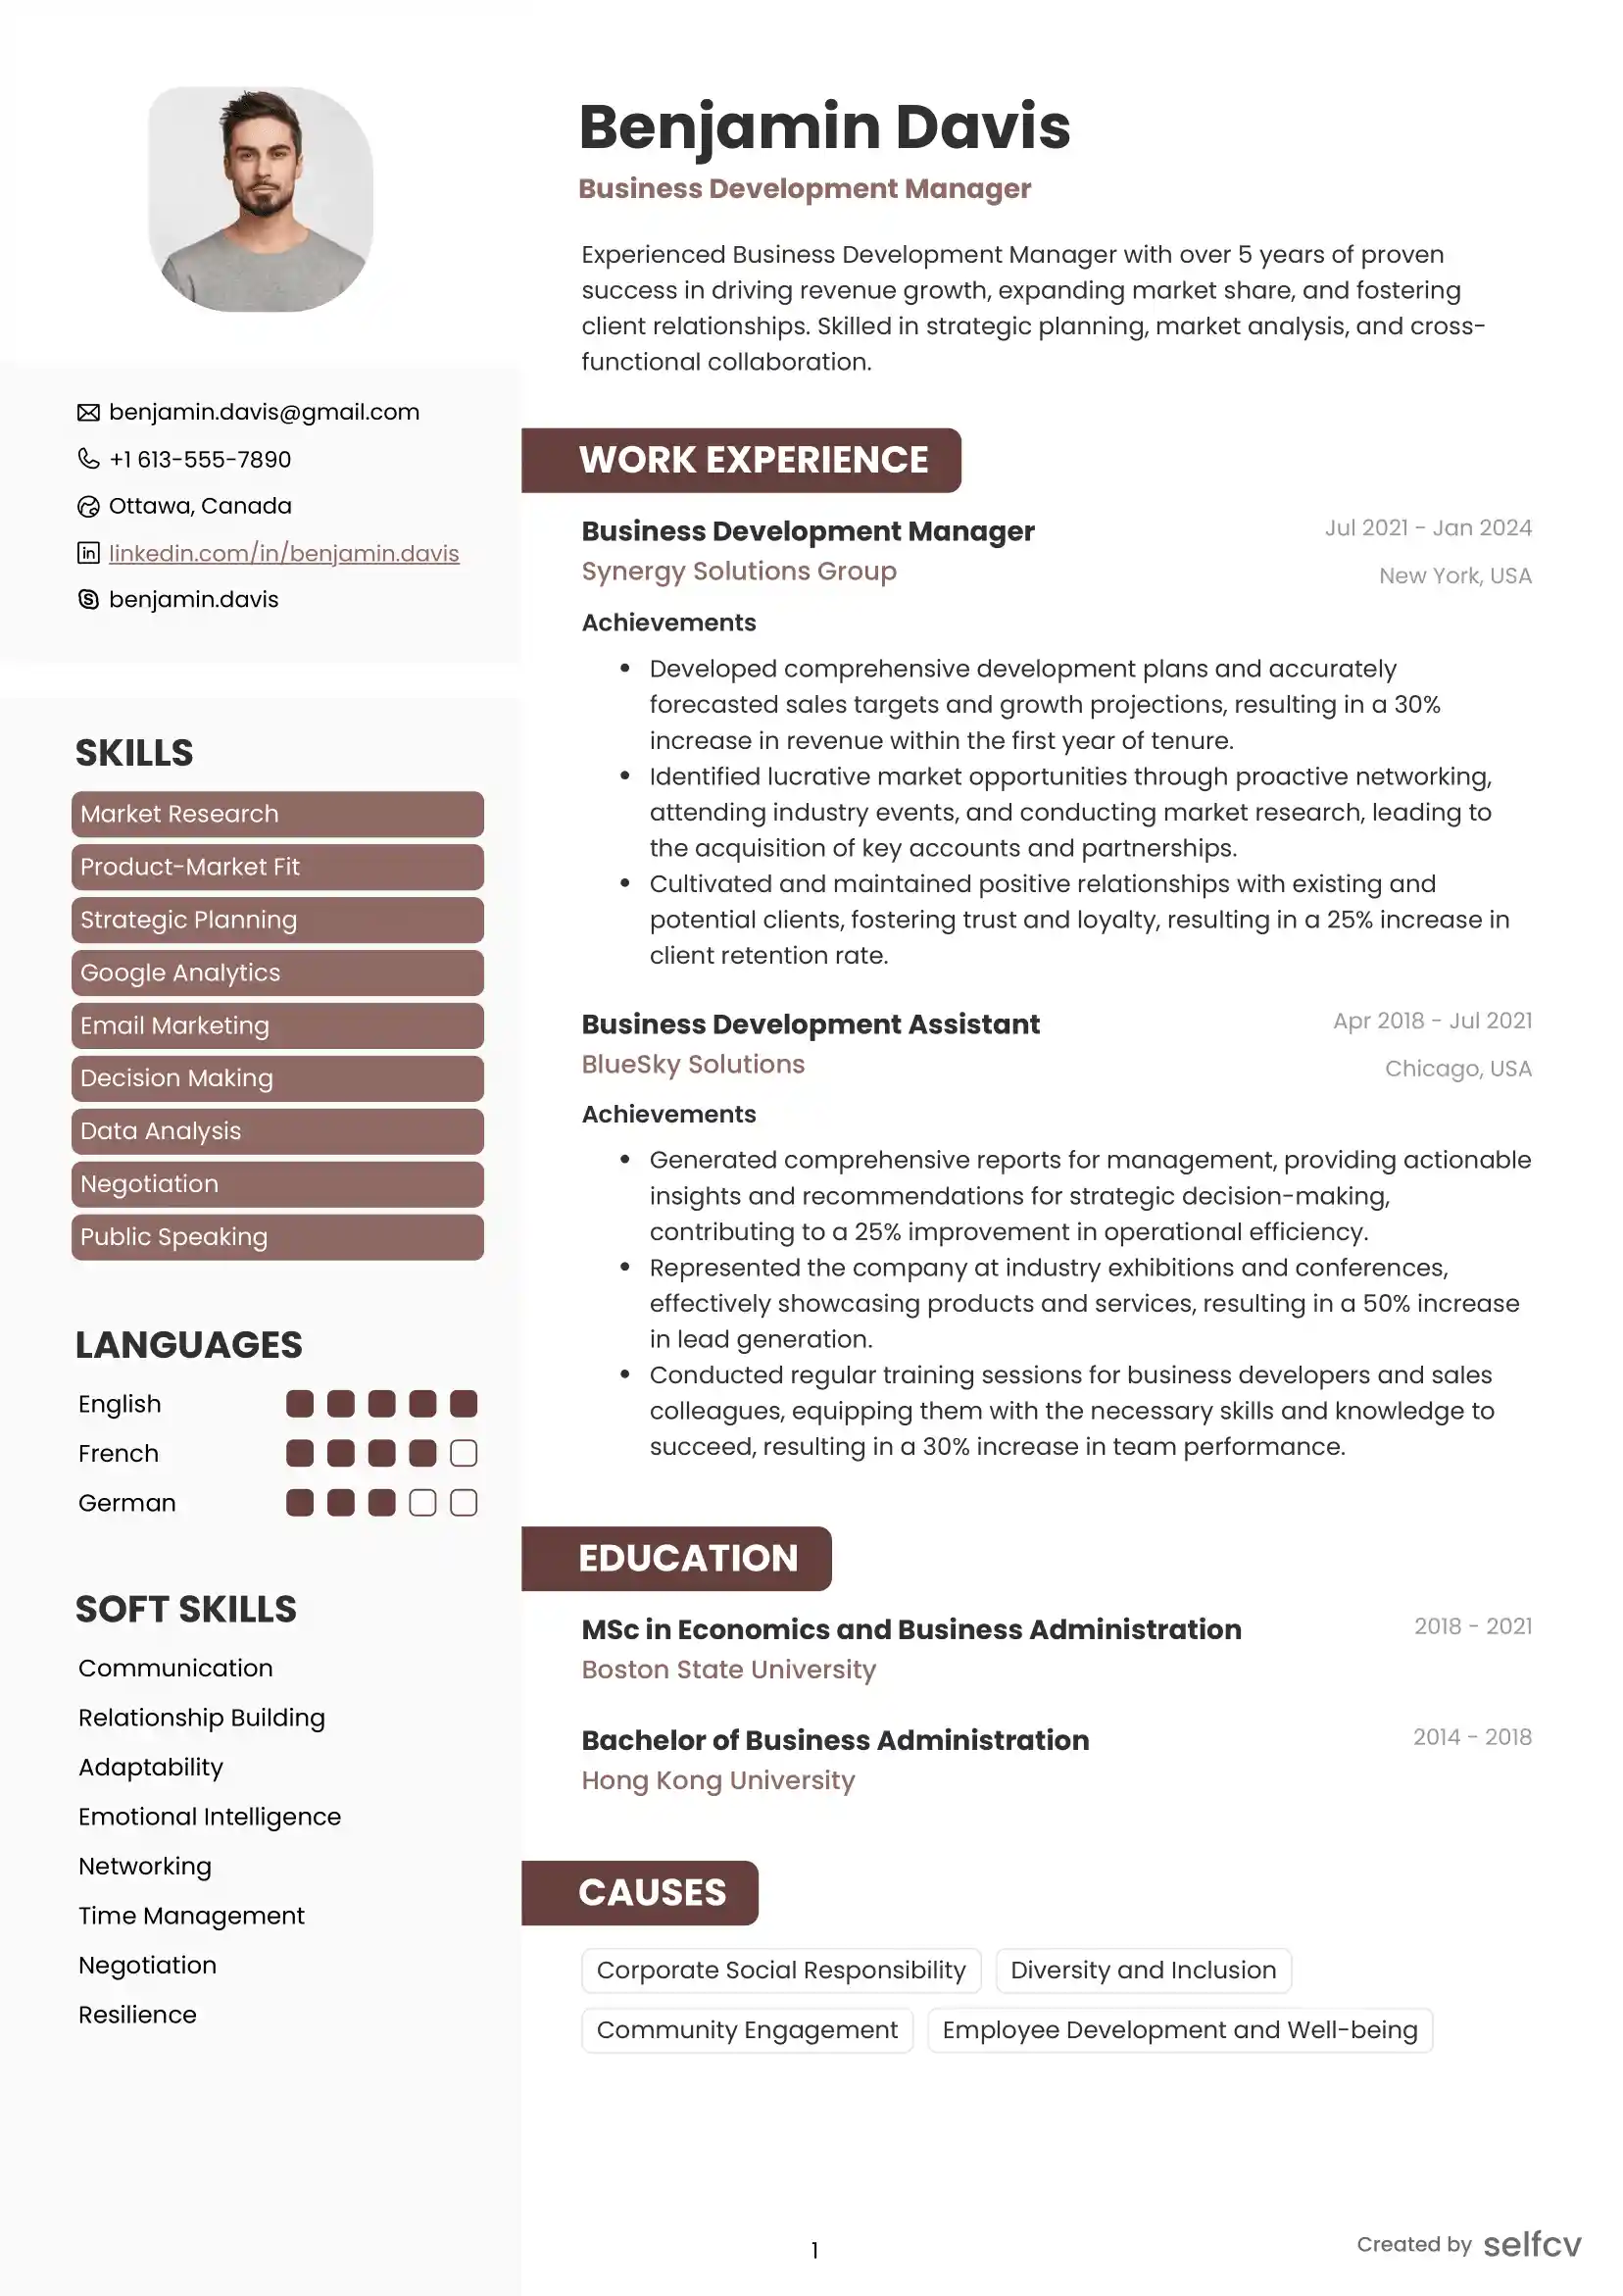
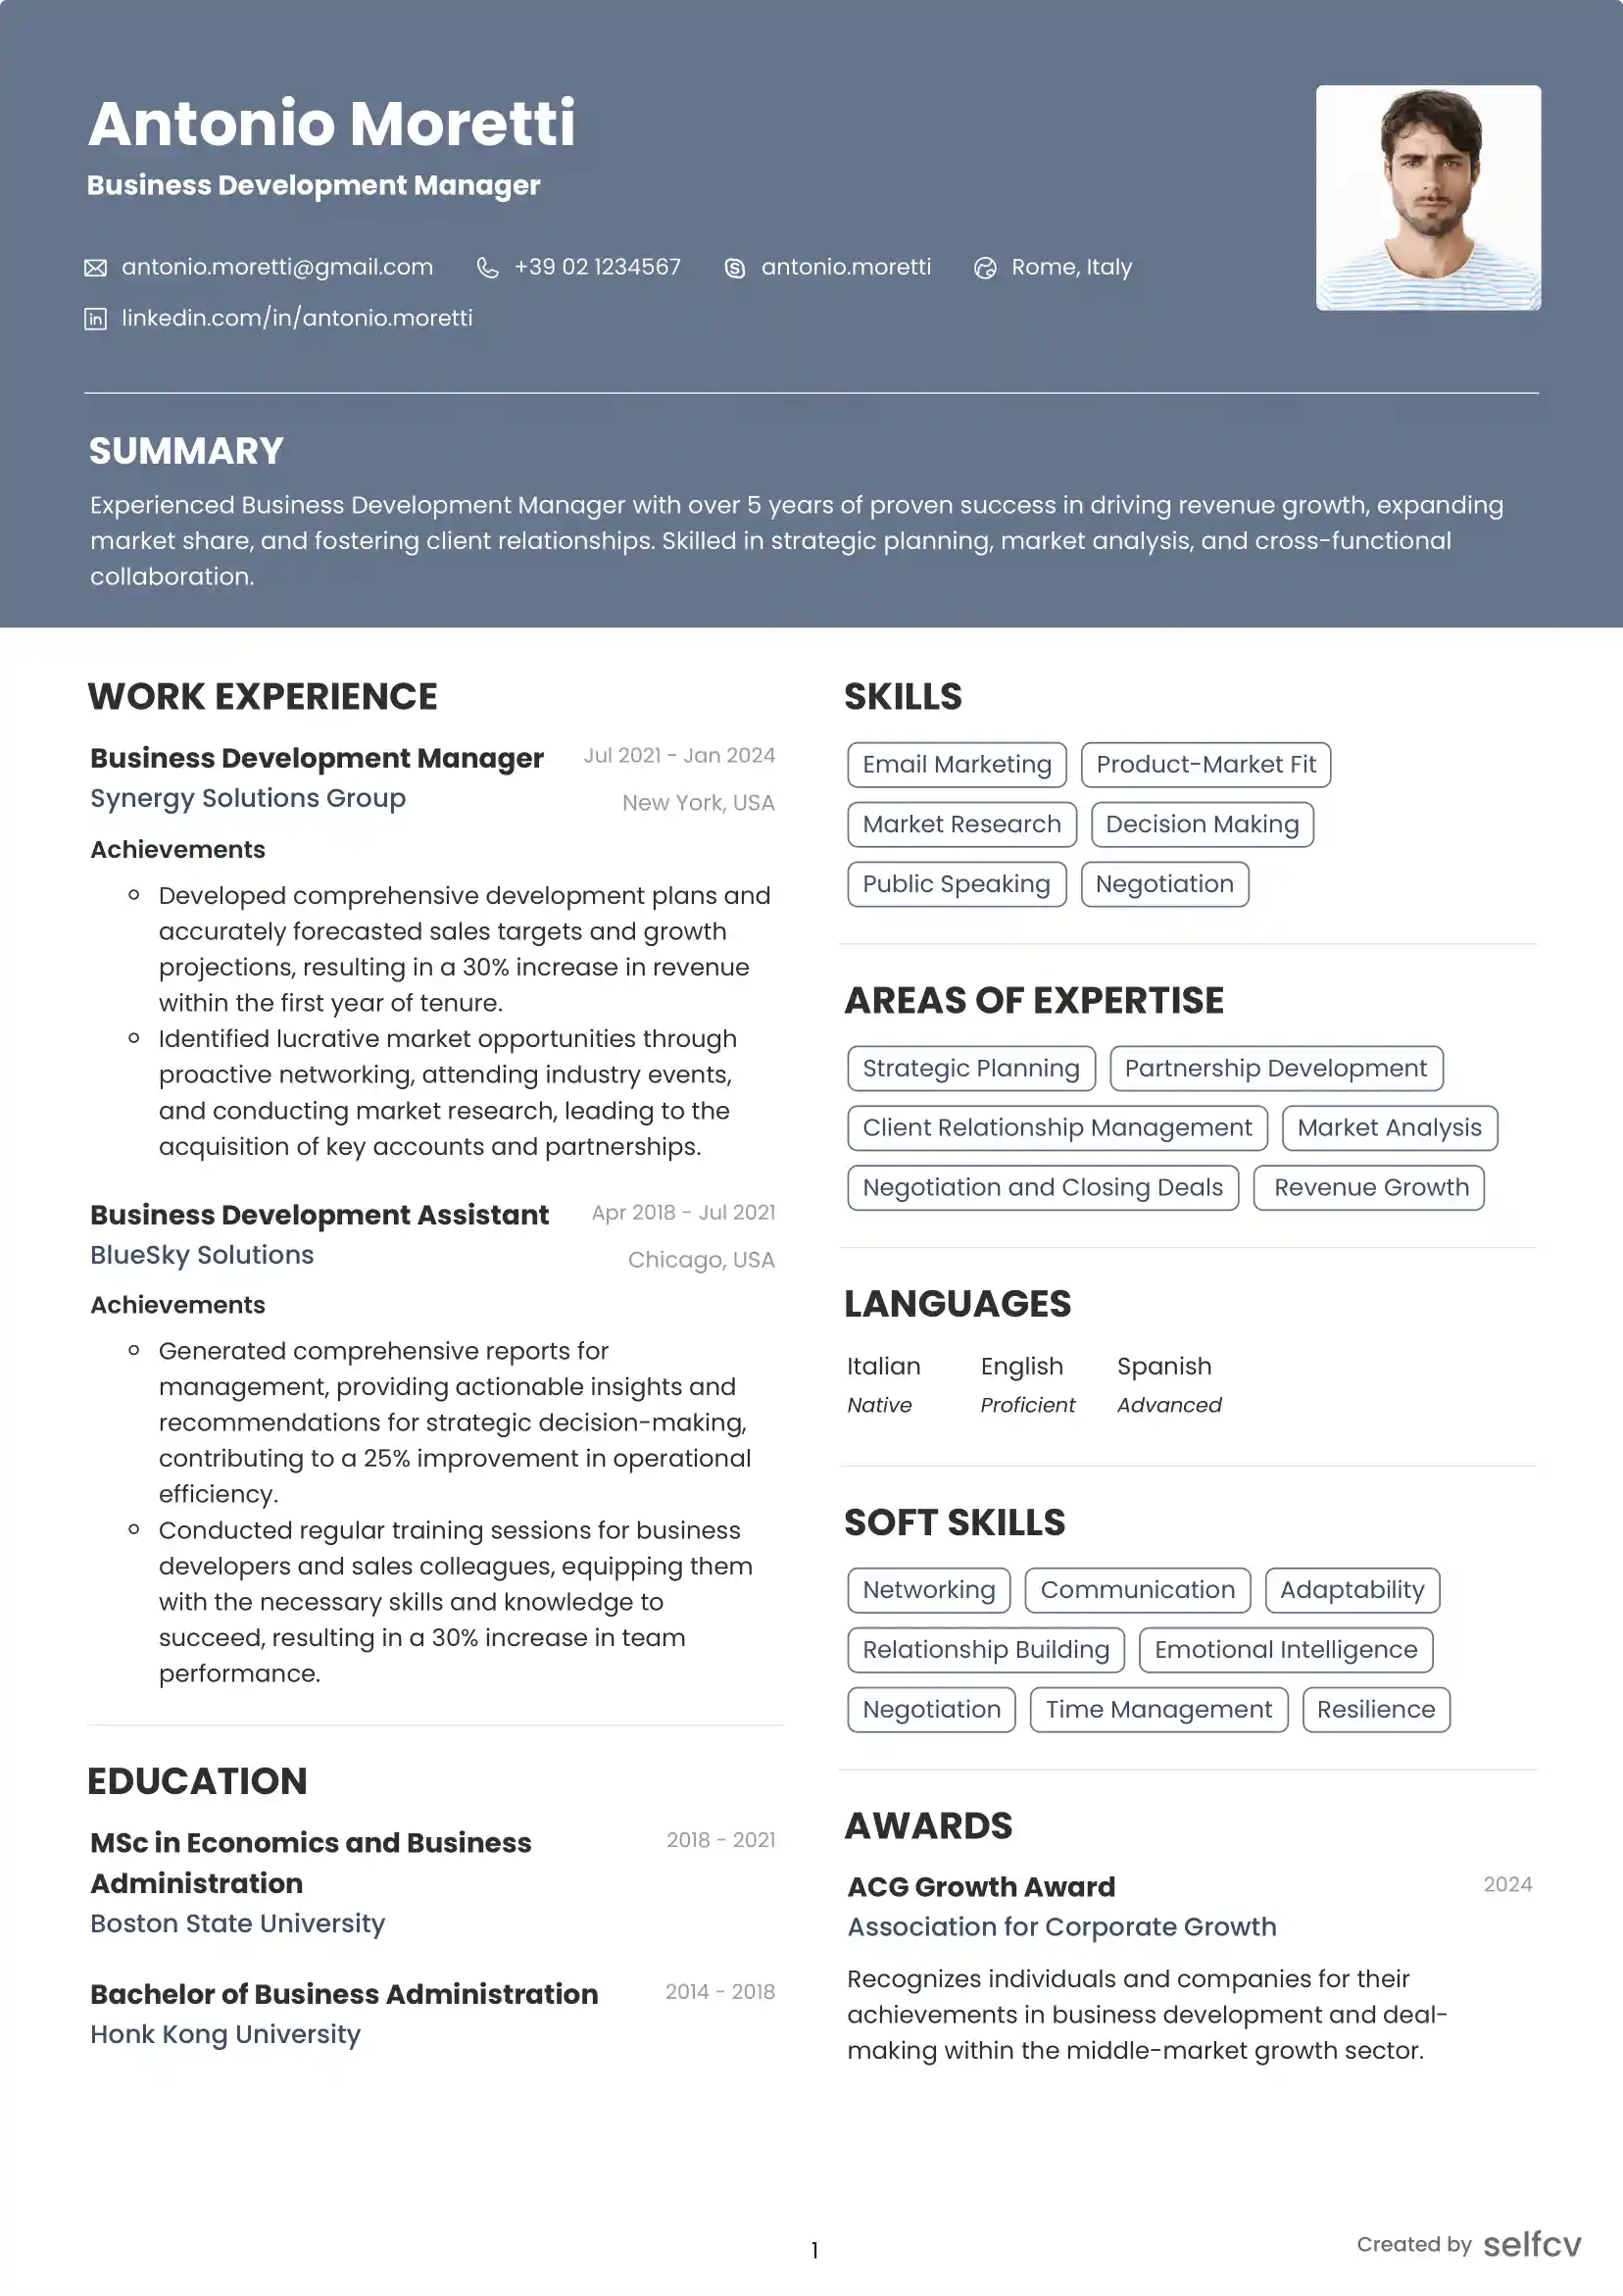
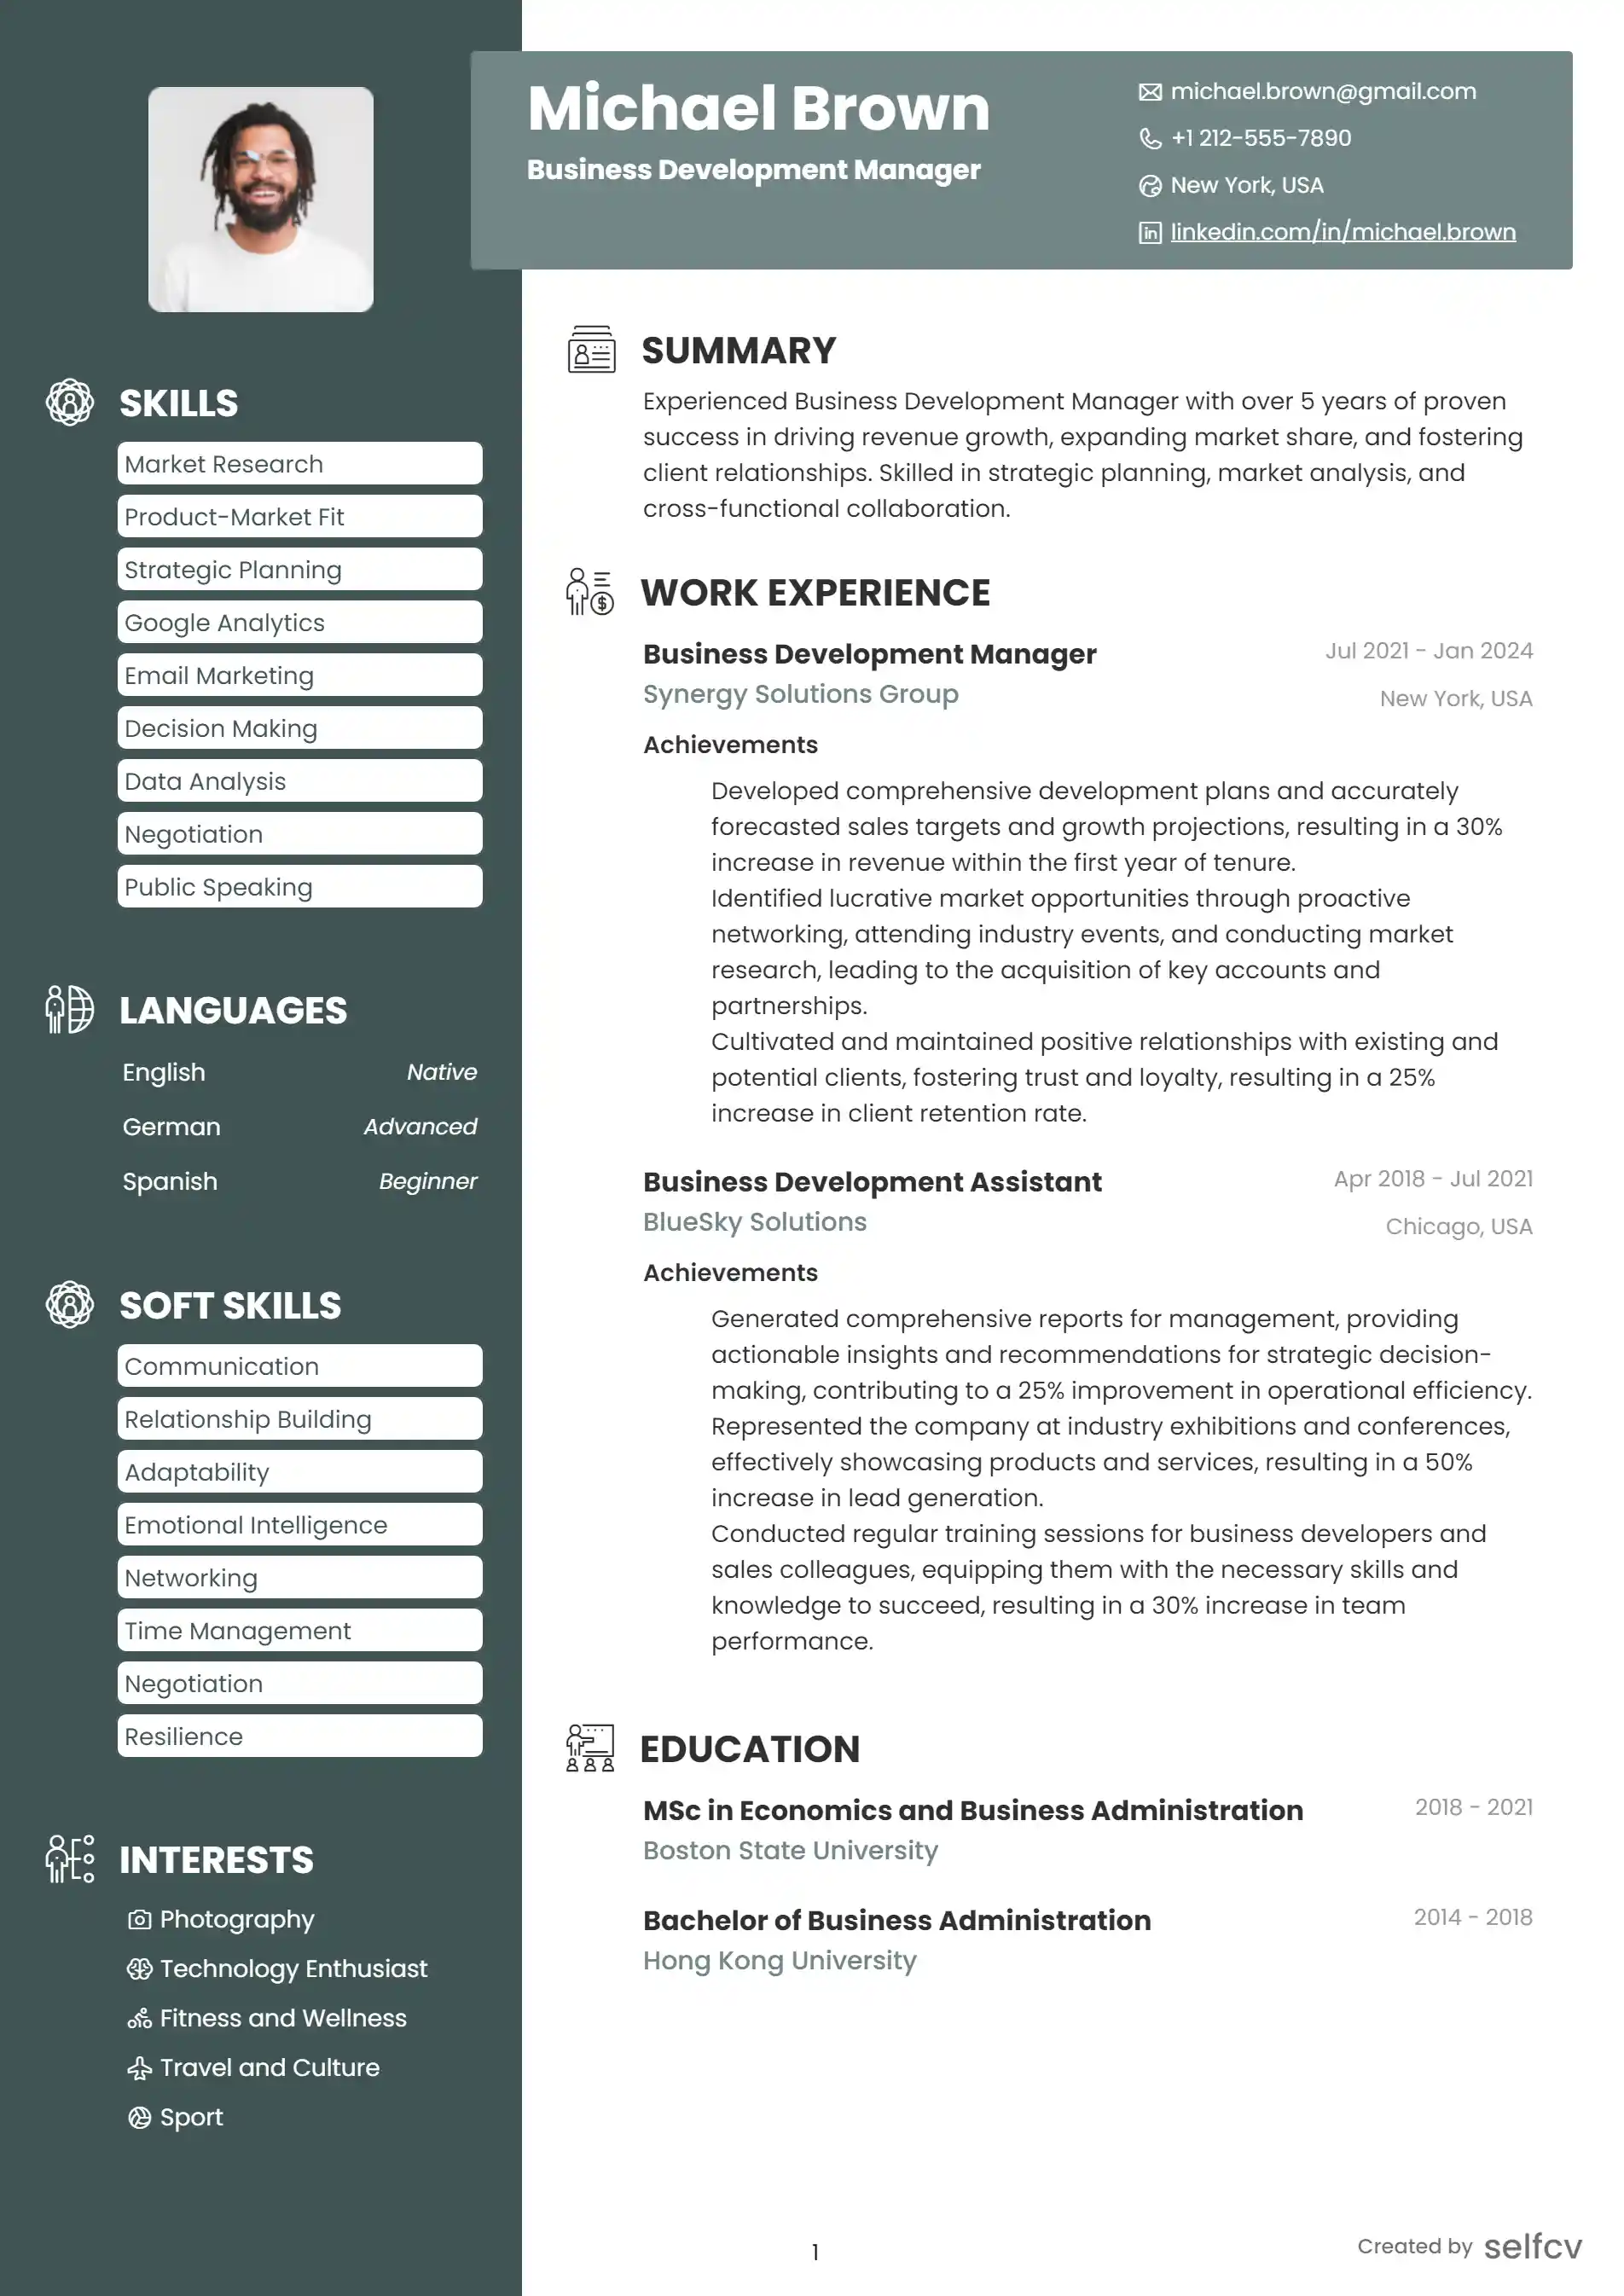
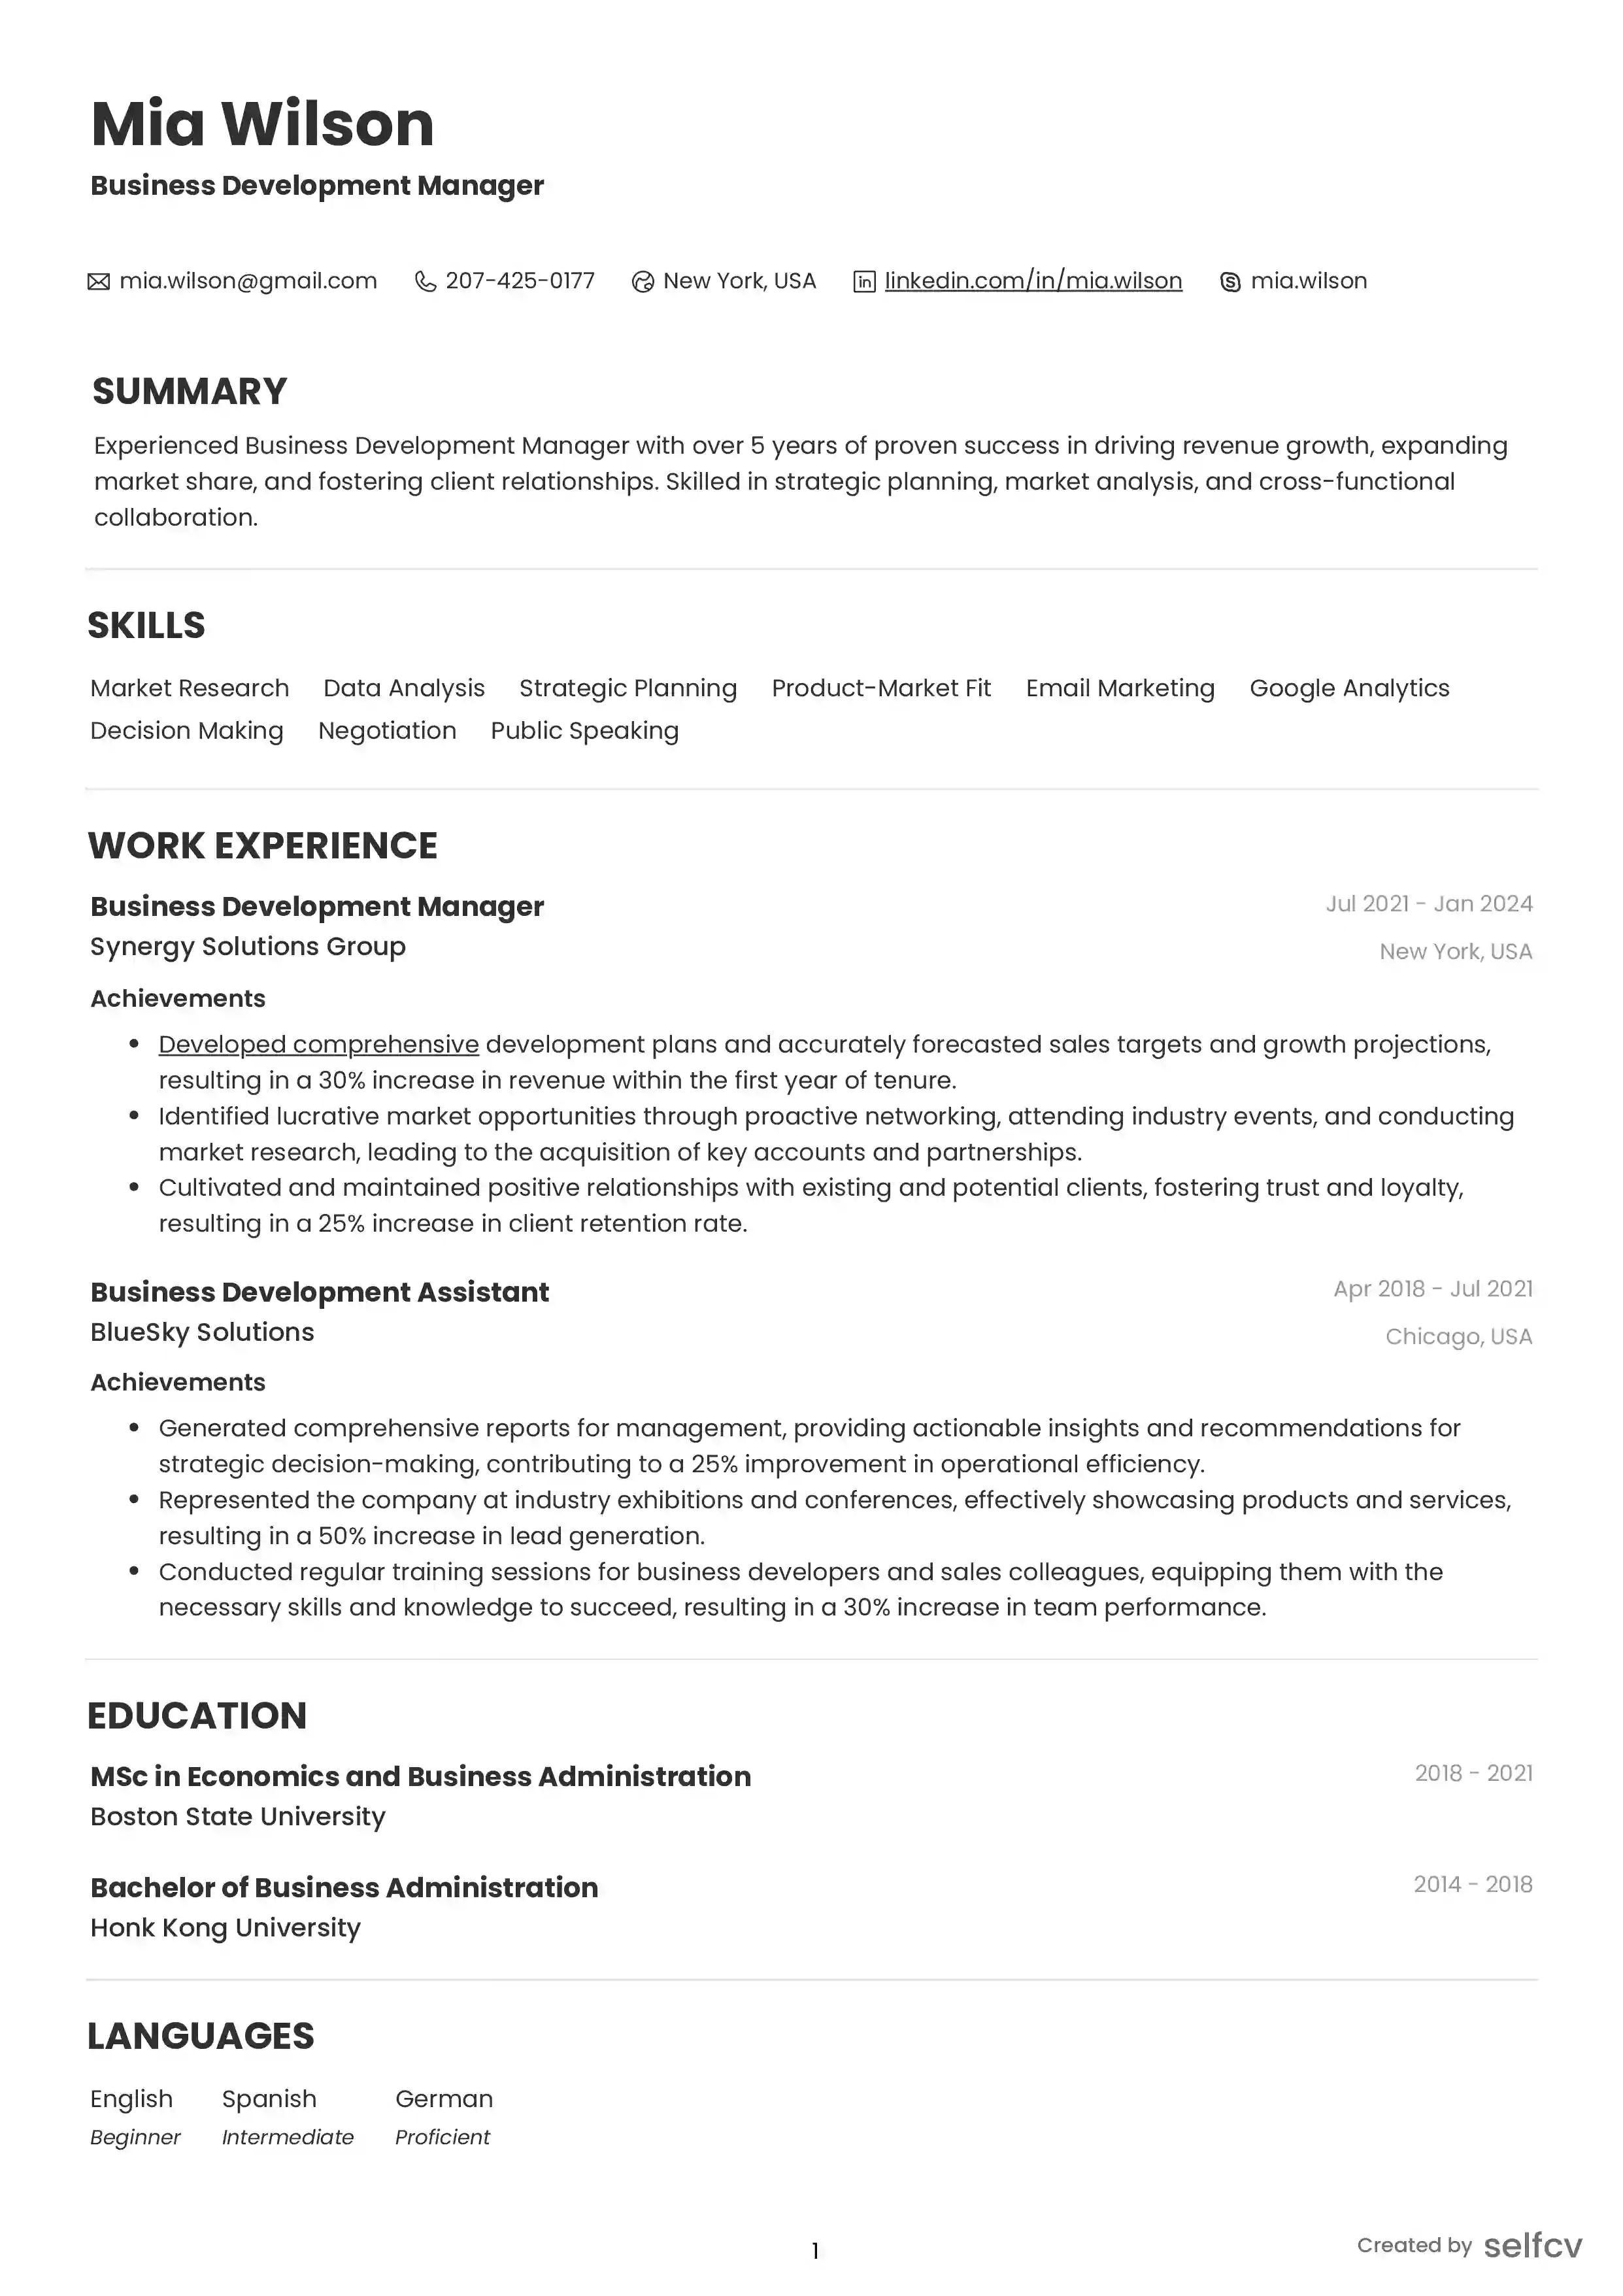
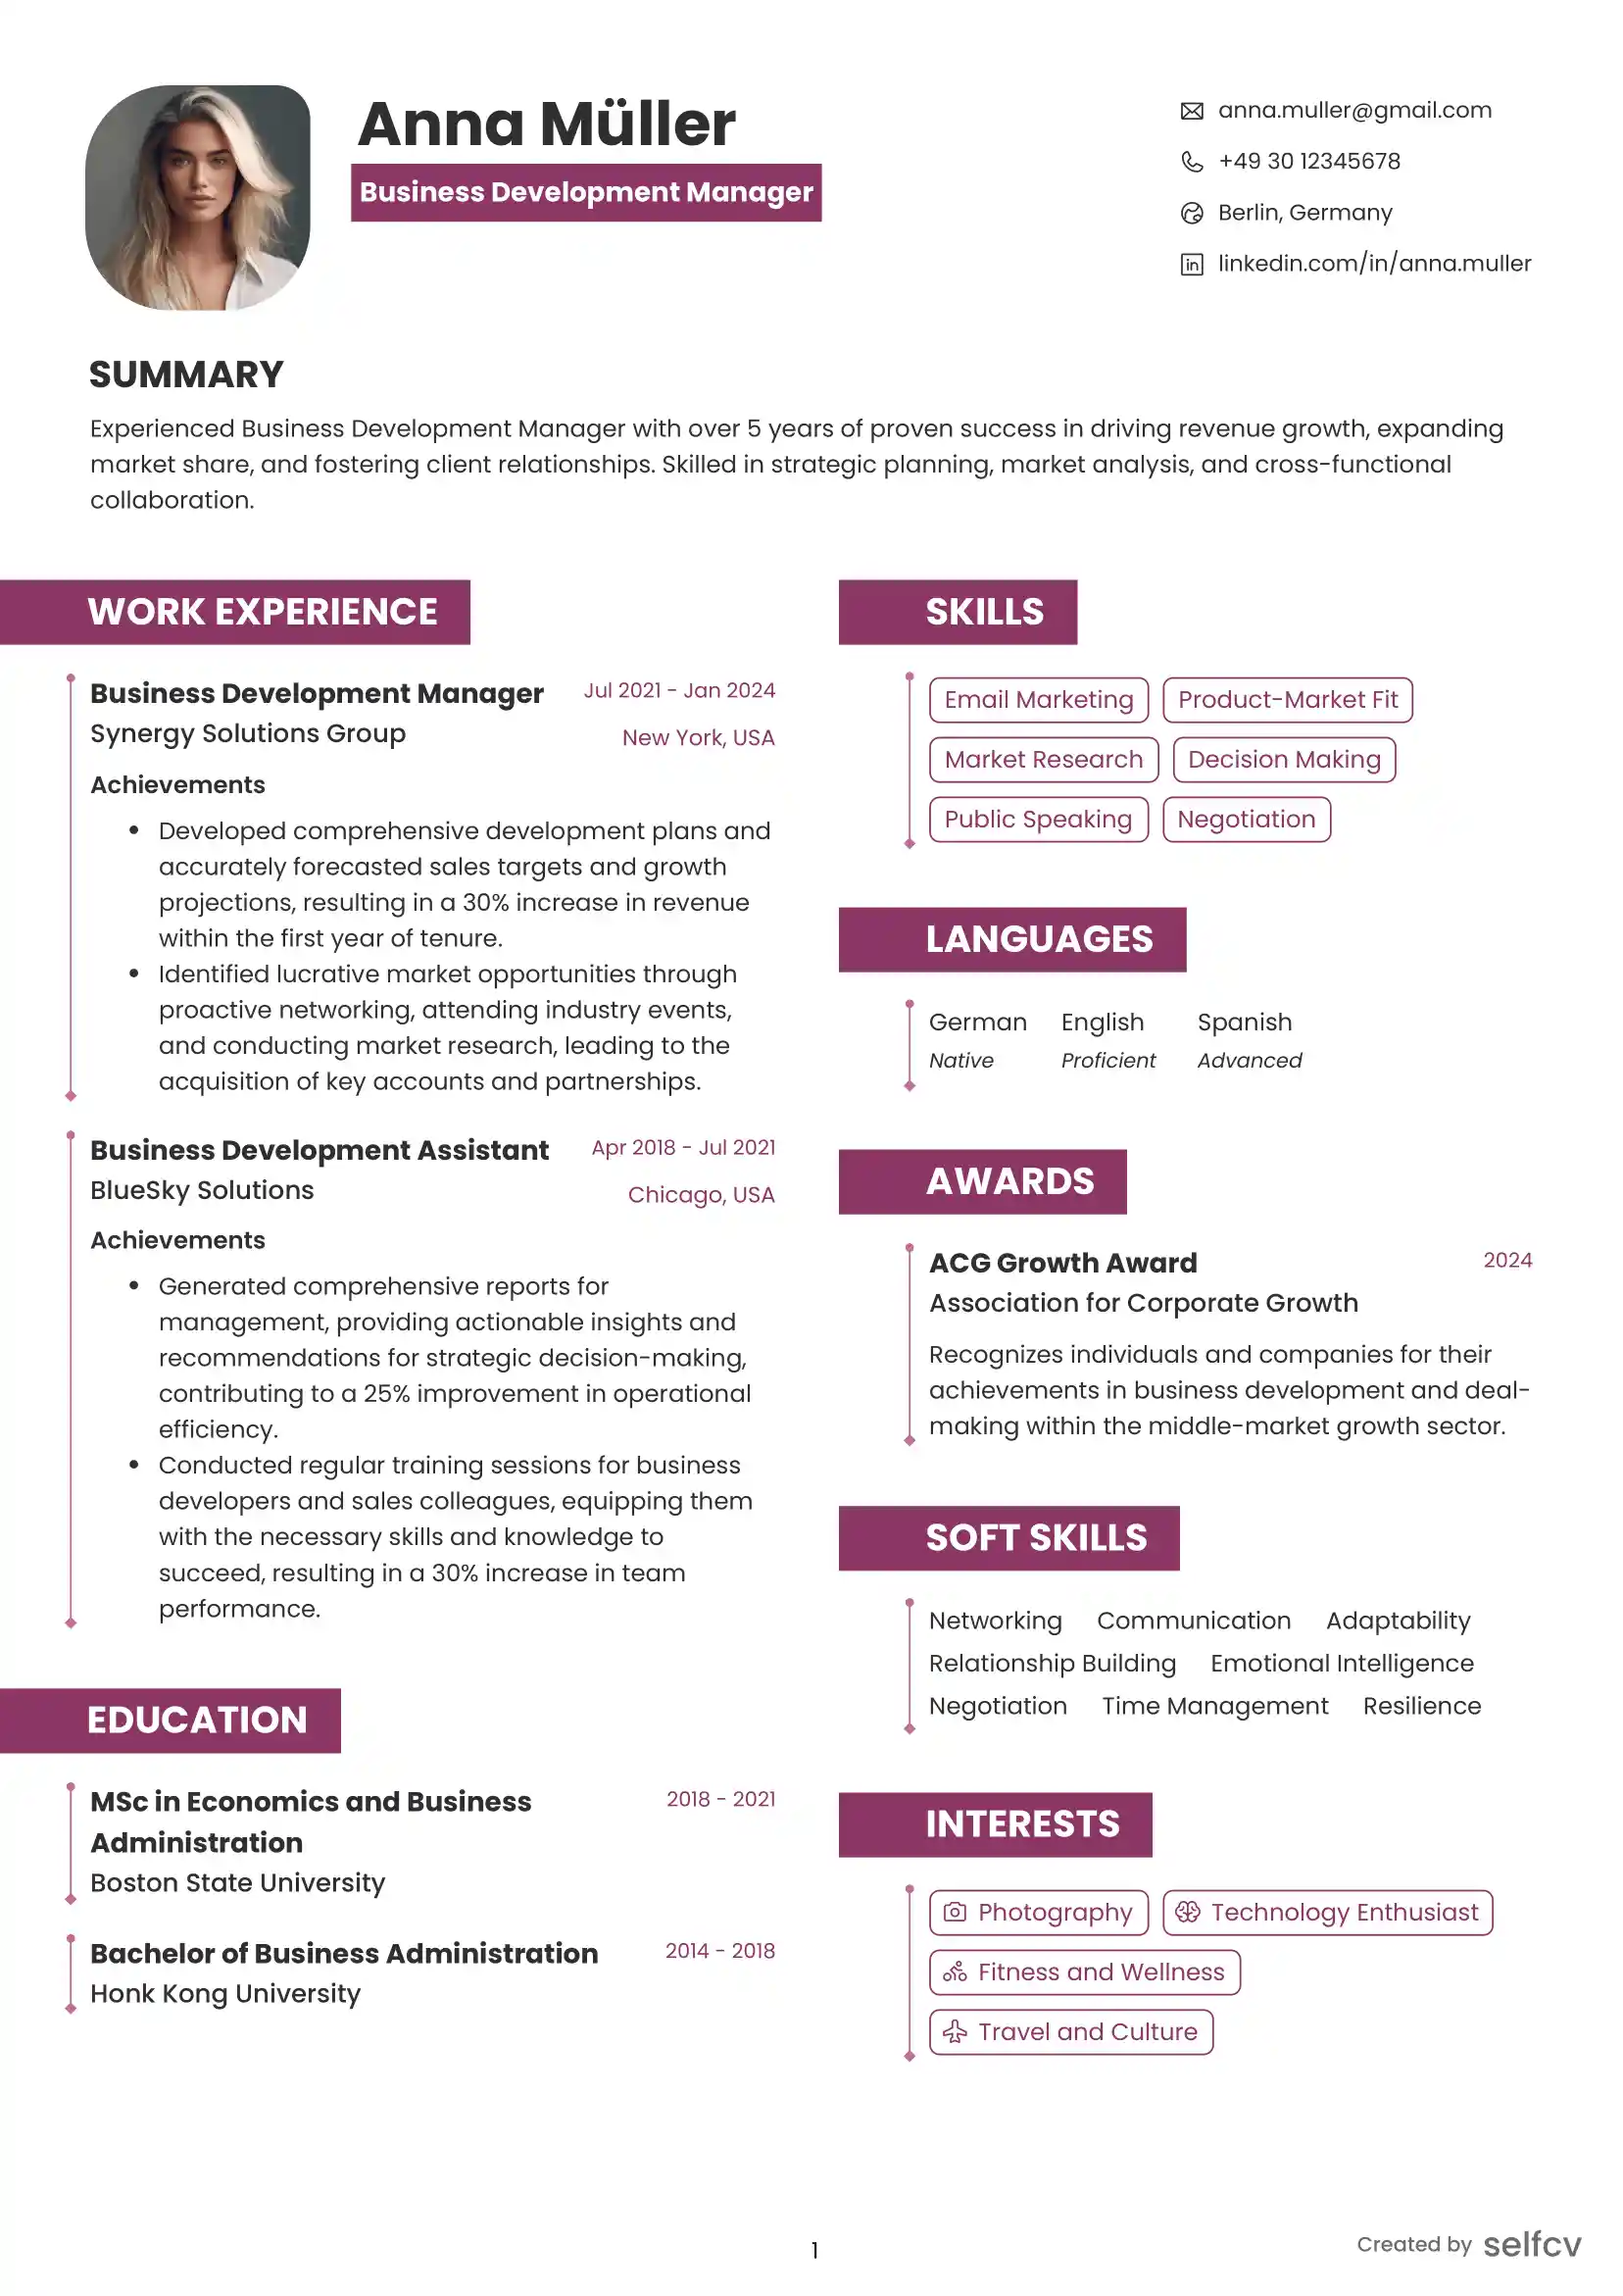
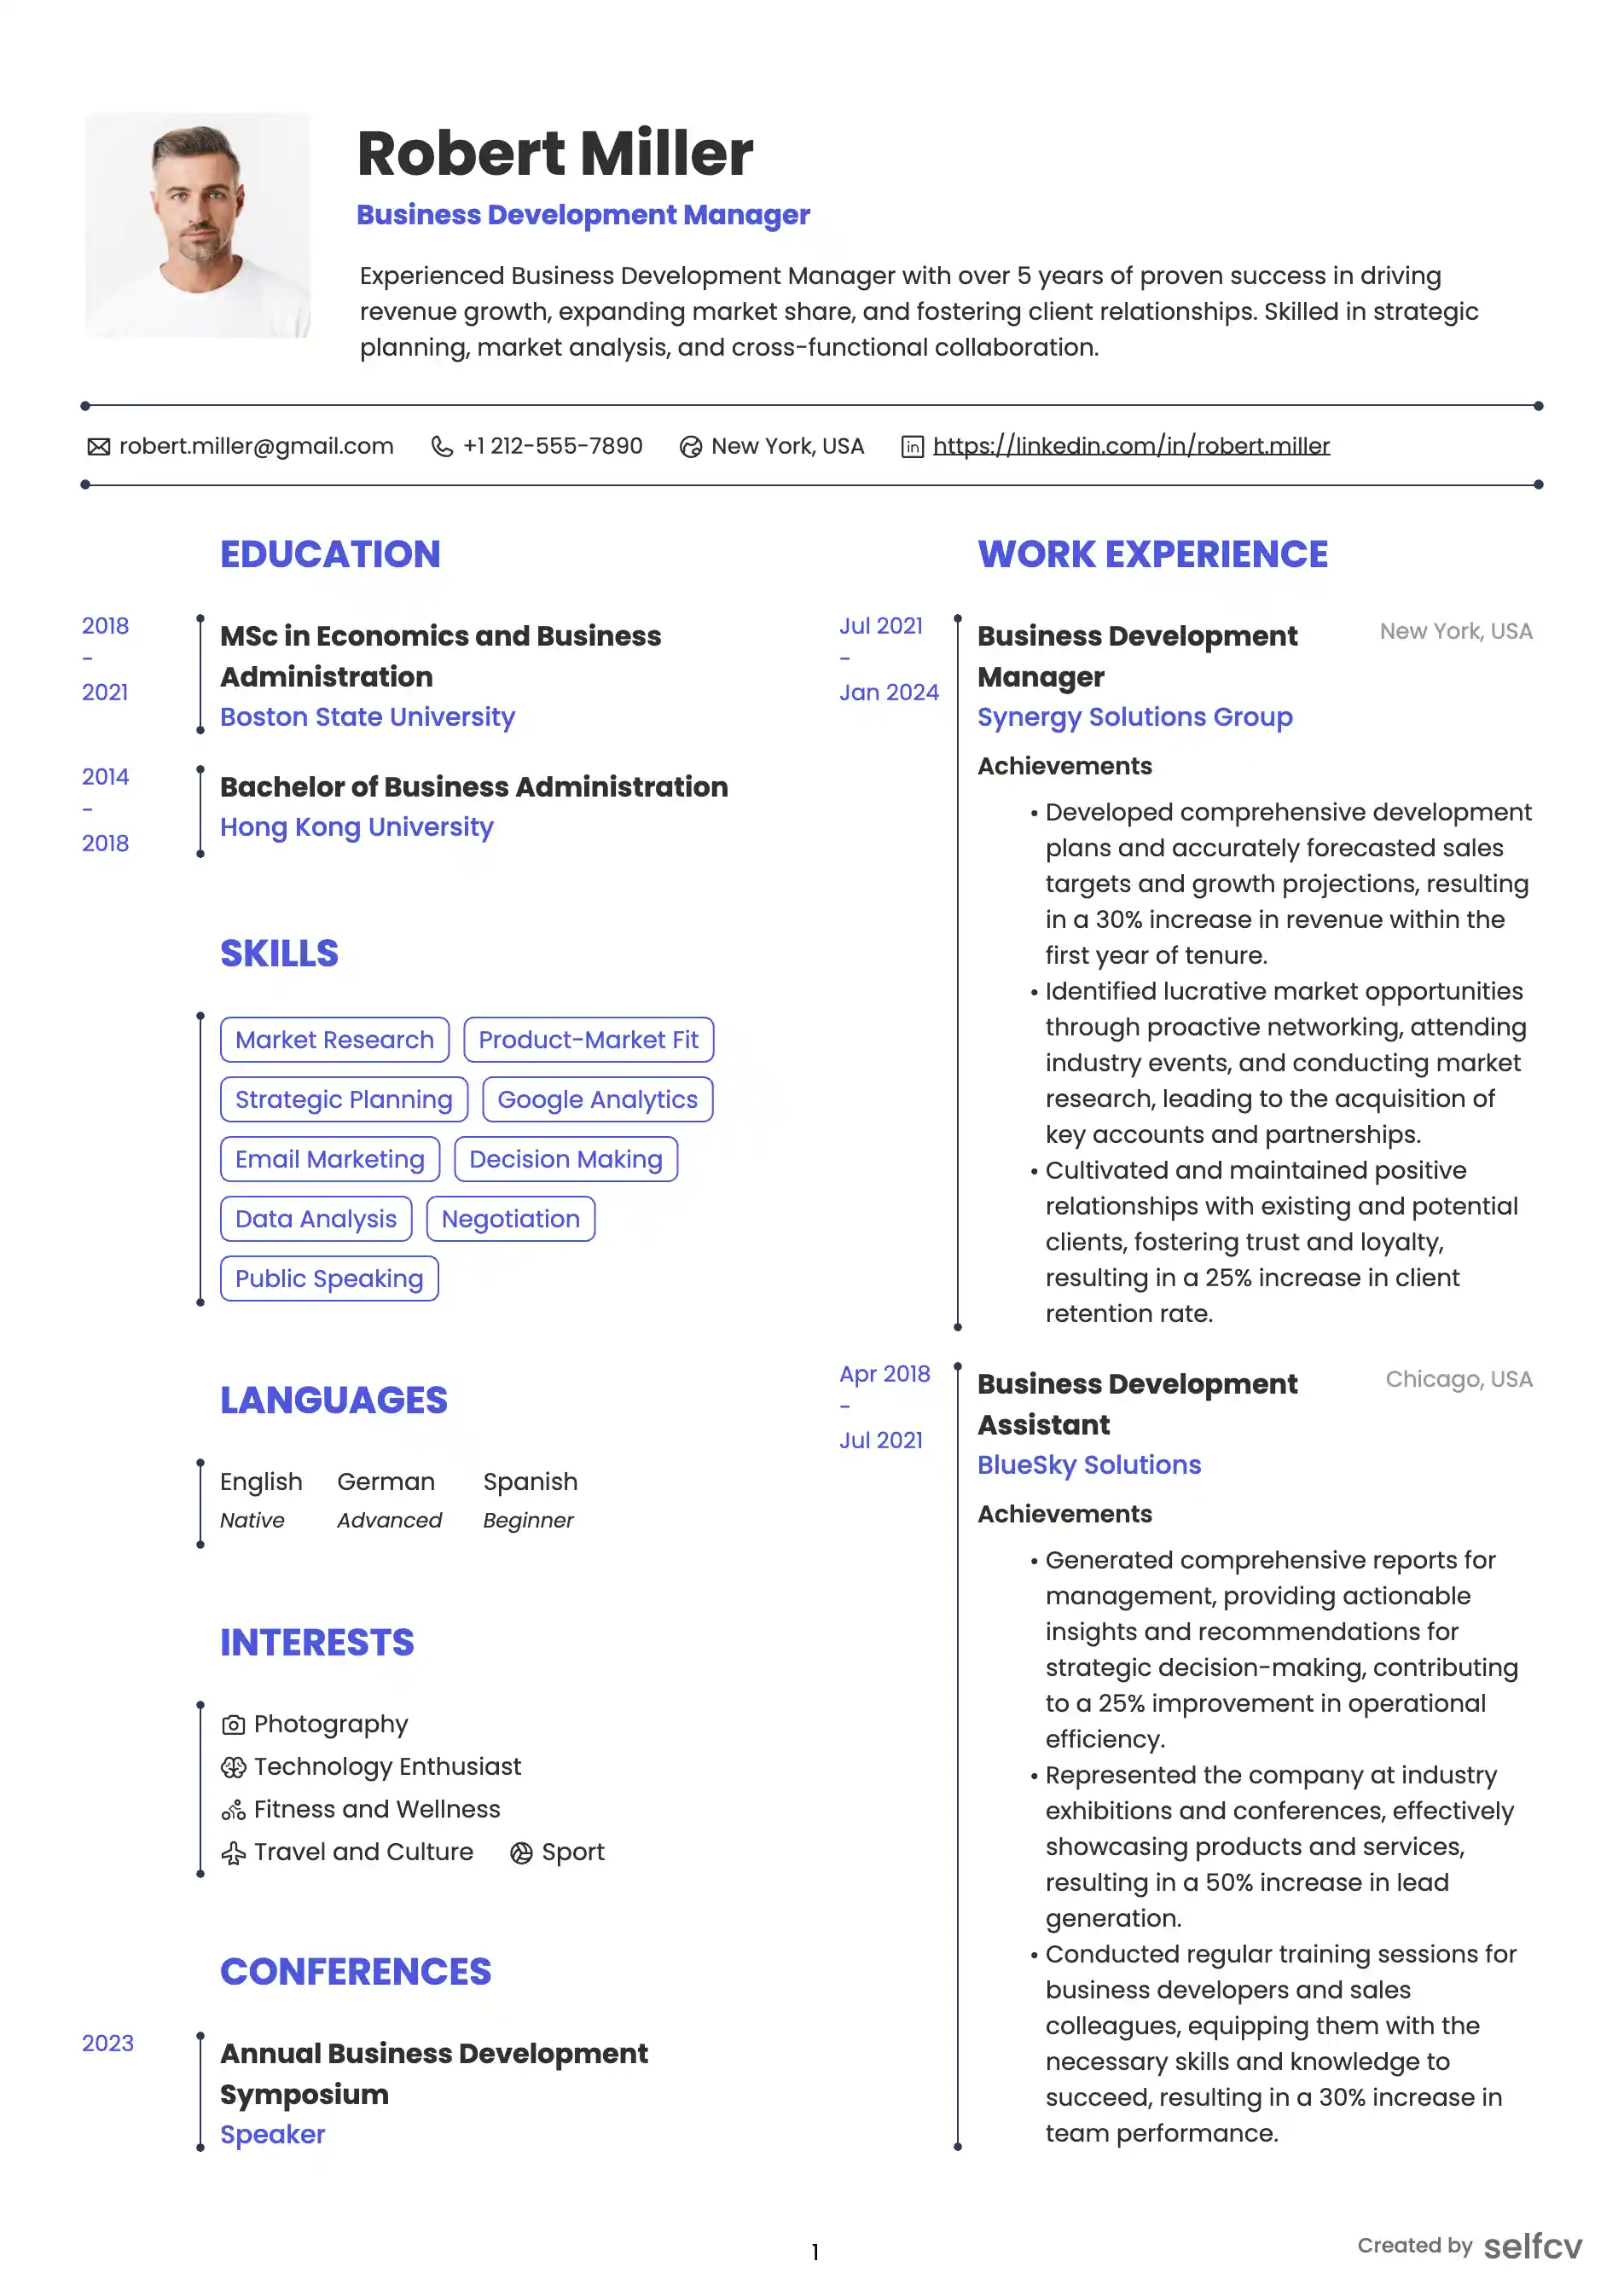
Find the template that’s right for you
No need to build anything from scratch. Using our templates or upload feature, you’ll get started easily and have a powerful resume in a few clicks.
Summary examples for junior, middle-level, and transition paths
Junior Business Intelligence Analyst summary example:
Junior Business Intelligence Analyst with hands-on experience in SQL, Excel, Power BI, and dashboard support through internship and project work. Built reporting views, cleaned source data, and supported recurring KPI reporting for operational teams. Eager to grow in dashboard development, metric design, and stakeholder-facing analytics.
Middle-level Business Intelligence Analyst summary example:
Business Intelligence Analyst with 4 years of experience building SQL-based reports, Power BI and Tableau dashboards, and KPI frameworks for commercial and operational teams. Strong record of reducing manual reporting effort, improving data consistency, and delivering dashboards that managers actually use.
Career changer summary example:
Analytical operations professional transitioning into Business Intelligence after building Excel reporting tools, performance trackers, and SQL-based analysis for internal teams. Brings strong stakeholder communication, process understanding, and growing experience in dashboard design, data validation, and BI reporting workflows.
Power BI Analyst summary example:
Power BI Analyst experienced in report design, DAX-based calculations, data modeling support, refresh management, and stakeholder-led KPI dashboards. Focused on building clear, practical reporting for business teams that need fast answers without losing metric consistency.
Tableau Analyst summary example:
Tableau Analyst with experience creating interactive dashboards, executive summaries, and operational reporting views across service, sales, and customer data. Strong at turning reporting requests into visuals that balance clarity, drilldown depth, and performance.
Skills to group by how BI work actually gets delivered
Querying and data preparation:
SQL, joins, unions, CTEs, views, data cleaning, data profiling, Excel, Power Query, spreadsheet logic, CSV handling, ETL basics, data transformation
Visualization and dashboard tools:
Power BI, Tableau, Looker Studio, SSRS, dashboard design, filters, drilldowns, KPI cards, trend charts, layout planning, user-friendly reporting
Business intelligence workflow:
Requirements gathering, metric definition, report automation, refresh scheduling, stakeholder reviews, dashboard QA, documentation, data validation, report handover
Data environment and modeling exposure:
CRM data, ERP data, finance data, operations data, customer support data, product usage data, dimensional concepts, source-to-report logic, warehouse exposure, dbt basics
Reporting and analysis outputs:
Executive dashboards, monthly KPI packs, performance scorecards, branch reporting, customer dashboards, SLA reporting, marketing performance views, revenue summaries, variance reporting
Governance and accuracy:
Metric consistency, access awareness, refresh checks, business rules, documentation, version control, exception reporting, privacy awareness, audit-friendly reporting habits
Communication and delivery:
Stakeholder workshops, translating requests, explaining data caveats, presenting findings, prioritizing report changes, balancing technical detail with business clarity
Relevant ATS keywords:
Business Intelligence Analyst, BI Analyst, Reporting Analyst, SQL Analyst, Power BI Analyst, Tableau Analyst, Data Visualization Analyst, Business Intelligence Developer, Business Analytics Analyst, BI Reporting Specialist
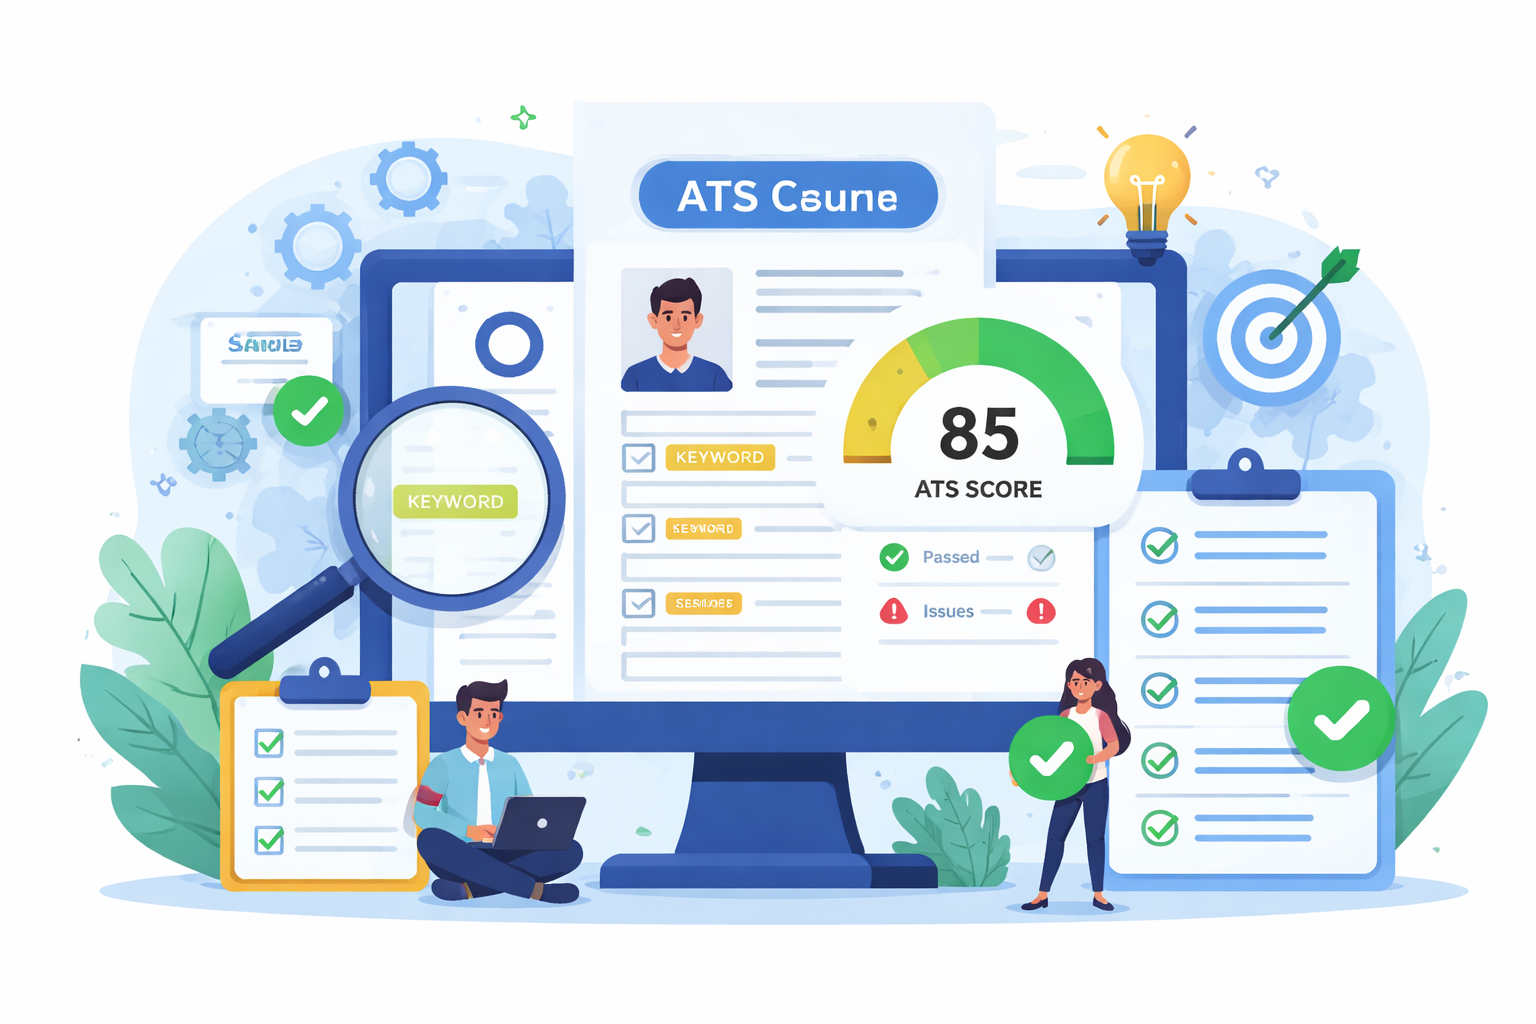
Check Your Resume with ATS
Make sure your resume passes Applicant Tracking Systems before recruiters see it.
- 📄 Upload your resume and get instant ATS feedback
- 🎯 Improve keyword matching for your target job
- ⚡ Boost your chances of getting shortlisted
When projects and dashboard portfolios strengthen the application
Projects matter more in BI than in many other professions, especially for junior candidates, career changers, and consultant-style roles.
A good BI project should show:
- The business question
- The data source or type of data used
- Cleaning or transformation steps
- KPI definitions or assumptions
- The dashboard or report output
- What a stakeholder could learn from it
Useful project types:
- Sales performance dashboard
- Inventory and replenishment dashboard
- Customer support SLA dashboard
- Finance variance or margin reporting pack
- Marketing campaign reporting dashboard
- Executive summary dashboard with drilldowns
- Data-quality or exception reporting view
If you include a portfolio link, make sure it is readable without explanation. A recruiter should be able to understand the business problem, the tool, and the value of the output quickly.
How junior and middle-level BI candidates should position themselves
Junior candidates should focus on readiness.
Strong junior signals:
- SQL and Excel confidence
- Dashboard projects or internships
- Data cleaning and validation habits
- Willingness to document business logic
- Curiosity about why metrics matter, not just how to calculate them
Middle-level candidates should focus on ownership.
Strong middle-level signals:
- Dashboards or reports owned end to end
- Reporting automation or process improvement
- KPI framework work
- Stakeholder management and requirement shaping
- Data issue detection and governance awareness
- Ability to support multiple business functions
Junior resumes should show technical promise and clean execution. Middle-level resumes should show judgment, consistency, and adoption.
Education, certifications, and domain context
Business Intelligence Analyst roles are usually skills-first, but education and training still help when they reinforce reporting credibility.
Relevant education:
Business analytics, data analytics, computer science, information systems, statistics, mathematics, economics, finance, or business with strong analytical coursework
Useful certifications and training:
Microsoft Power BI training, Tableau training, SQL coursework, advanced Excel training, data visualization courses, basic data warehousing or ETL training, cloud data platform fundamentals, and dashboard design workshops
Domain context can also matter. A BI Analyst working in retail, healthcare, SaaS, logistics, finance, education, or operations should make that industry language visible when it helps the employer place the work.
If your reporting involved sensitive customer, health, financial, or employee data, mention governance, access awareness, or reporting controls carefully. That helps show maturity without overstating compliance authority.
Mistakes that weaken a Business Intelligence Analyst resume
Tool dumping:
A long list of SQL, Power BI, Tableau, Python, Excel, and cloud tools means little without examples of what you built.
Charts without business context:
A BI resume should not read like a design portfolio. Hiring teams need to know which decisions the reporting supported.
No metric ownership:
If the resume never mentions KPI definitions, business rules, or consistency, it may look like you only formatted reports rather than understood them.
Overclaiming data engineering:
If your work mainly involved reporting and dashboards, do not present yourself as a full Data Engineer unless the experience truly supports that label.
Weak stakeholder language:
Built dashboard for team is vague. Explain which team, which problem, and what changed.
No data-quality awareness:
Missing refresh checks, exception handling, source validation, or documentation can make the resume feel incomplete.
Generic soft skills instead of proof:
Do not rely on phrases like detail-oriented or strong communicator without showing them through requirement gathering, cleaner metric definitions, or fewer reporting errors.
FAQs about Business Intelligence Analyst resumes
What should a Business Intelligence Analyst put on a resume?
Include BI tools, report types, business teams supported, KPI work, SQL or data preparation tasks, dashboard outputs, and measurable reporting improvements. The strongest resumes show how the reporting helped people make decisions.
Should I include Power BI or Tableau projects if I do not have a BI job title yet?
Yes. Strong projects can help bridge the gap for junior candidates and career changers, especially when they include a business question, a data source, a dashboard, and a clear explanation of what the output shows.
How technical should a BI Analyst resume be?
Technical enough to prove you can do the work, but readable enough for recruiters and business hiring managers. Name the tools, logic, and validation habits, then connect them to business users and reporting outcomes.
What metrics matter on a BI resume?
Useful metrics include reporting time reduced, dashboards adopted, manual reports replaced, data errors detected, refresh reliability improved, or number of reports standardized. Choose metrics that match your actual contribution.
Can a Data Analyst use the same resume for Business Intelligence Analyst jobs?
Often yes, but the emphasis should shift. A BI resume should lean more into recurring reporting, dashboard design, KPI definitions, stakeholder-facing reporting, and data consistency than pure ad hoc analysis.
Do I need a portfolio for a Business Intelligence Analyst role?
Not always, but it helps a lot for entry-level and junior applicants. A clean dashboard portfolio can make Power BI Analyst, Tableau Analyst, and Business Intelligence Developer candidates easier to shortlist.
How can I make my BI resume ATS-friendly?
Use clear, natural keywords that match your real background, such as Business Intelligence Analyst, BI Analyst, Reporting Analyst, SQL Analyst, Power BI, Tableau, dashboard development, KPI reporting, data visualization, data validation, and stakeholder reporting. Place them inside real accomplishments rather than in a long keyword block.
A stronger closing perspective for Business Intelligence Analyst candidates
The best Business Intelligence Analyst resumes make one thing easy to believe: your reporting helps the business see performance more clearly.
That can mean better dashboards, cleaner KPI logic, less manual reporting work, stronger validation, or reporting that managers actually use. When those outcomes are visible with enough detail, the resume feels like a true BI profile rather than a generic data-tools résumé.
Why job seekers choose selfcv
Thousands of professionals use selfcv to build modern, ATS-friendly resumes, customize templates, and apply for jobs with confidence.
Thanks to SelfCV, I now have a professional and polished resume that I'm confident in sending to potential employers. I will definitely be recommending your service to other job seekers. Keep up the great work!
SelfCV offers an intuitive interface that makes creating a professional CV straightforward. Whether you're a student, a fresh graduate, or an experienced professional, the step-by-step process ensures that users of all levels can craft an impressive CV.
Easy to use resume builder. They have very intuitive ui for customizing and keeping multiple versions of resume.
The right tool for creating CVs. As a student I was looking for a tool that could help me quickly create a CV for internship applications. This was just the right tool. I am very satisfied!
This is one of the best tools I’ve ever used - I was able to build my CV in seconds with high quality template. Highly recommended!
Amazing app with easy user experience. Loved it. Its intuitive and easy to navigate, designs are very nice.
